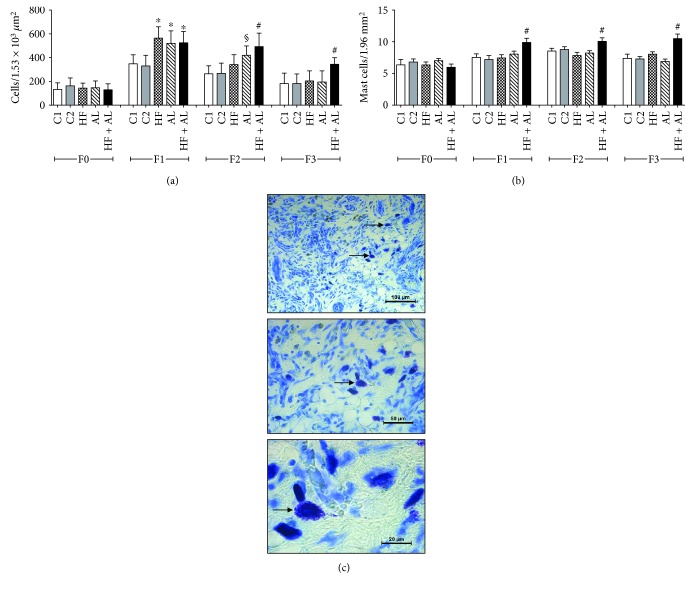
Figure 2.
Effects of alcohol and high-fat diet on the total amount of cells (a), number of mastocytes (b), and mast cells in the scar tissue of HF + AL (c) in skin wounds of Wistar rats. C1 = control 1—water via gavage and standard chow diet; C2 = control 2—water (no gavage) and standard chow diet; AL = alcohol—water (no gavage), alcohol (40%) via gavage and standard chow diet; HF = high-fat—water (no gavage) and high-fat diet (50%); HF + AL = alcohol/high-fat—water (no gavage), alcohol (40%) via gavage and high-fat diet. F0 = intact tissue; F1, F2, and F3 = scar tissue after 7, 14, and 21 days, respectively. ∗ indicates statistical differences versus C1 and C2; § indicates statistical difference versus C1, C2, HF, and HF + AL; # indicates statistical difference versus C1, C2, AL, and HF. Arrows show the distribution of mast cells in the cicatricial tissue of HF + AL mice during F3 periods (c). Toluidine blue, bar: 100 μm (10x), 50 μm (20x), and 20 μm (100x).

