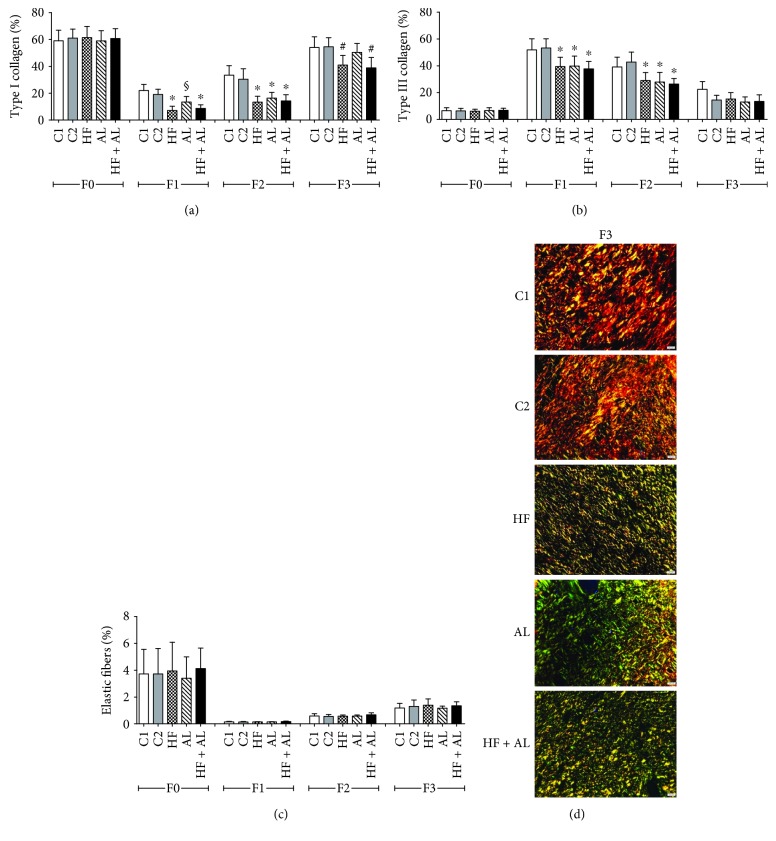
Figure 5.
Effects of alcohol and high-fat diet on the total amount of type I collagen (a), type III collagen (b), and elastic fibers (c) in skin wounds of Wistar rats. Photomicrographs taken under polarized light demonstrating collagen distribution on scar tissue, showing red fibers (collagen I) and green fibers (collagen III) (d). C1 = control 1—water via gavage and standard chow diet; C2 = control 2—water (no gavage) and standard chow diet; AL = alcohol—water (no gavage), alcohol (40%) via gavage and standard chow diet; HF = high-fat—water (no gavage) and high-fat diet (50%); HF + AL = alcohol/high-fat—water (no gavage), alcohol (40%) via gavage and high-fat diet. F0 = intact tissue; F1, F2, and F3 = scar tissue after 7, 14, and 21 days, respectively. Bar: 20 μm. Sirius Red staining. ∗ indicates statistical differences versus C1 and C2; # indicates statistical difference versus C1, C2, and AL; § indicates statistical difference versus C1, C2, HF, and HF + AL.

