Figure 2.
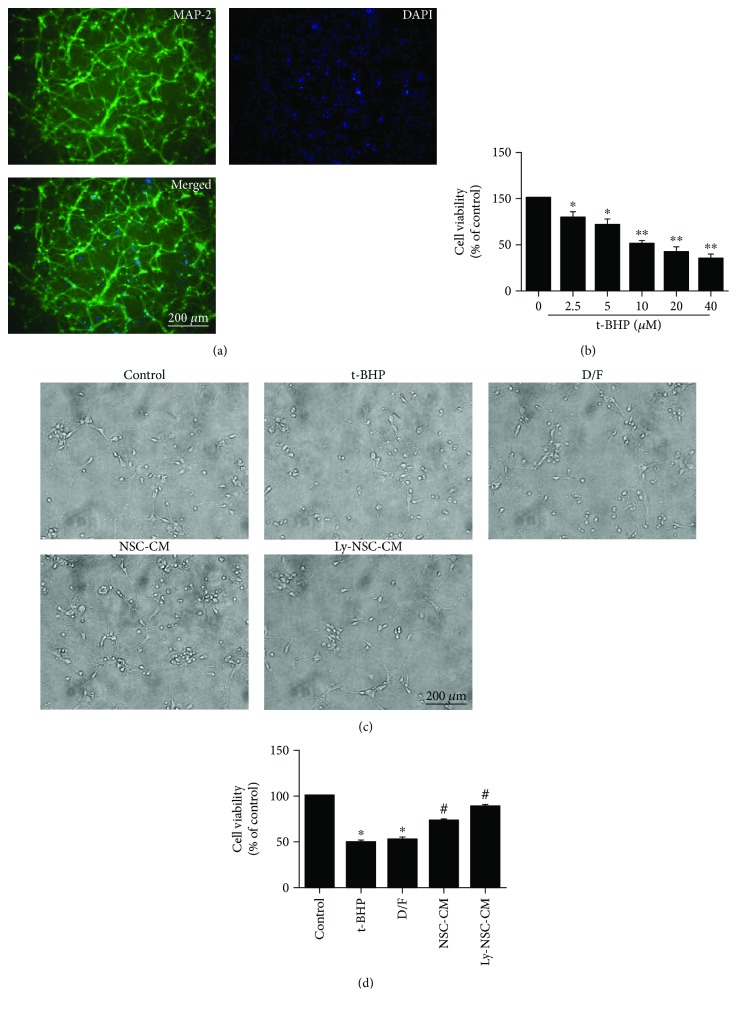
The effects of Ly-NSC-CM treatment on neuronal damage. (a) Neocortical neuron identification: analysis of MAP-2 (green) protein immunofluorescence in mouse primary neocortical neuron cultures. (b) Neurons were treated with t-BHP from 2.5 μM to 40 μM for 24 h, and cell viability was examined by MTT assay. (c) The morphology of neocortical neurons and their neurite extensions. (d) Neuronal cell viability according to an MTT assay. n = 3 per group. Data are described as mean ± SEM. ∗P < 0.05 versus control group. #P < 0.05 versus t-BHP group.

