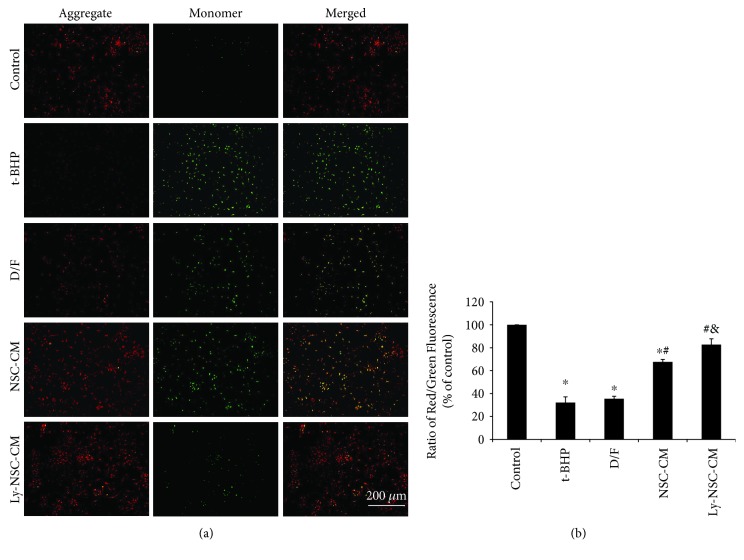
Figure 4.
Effect of indicated treatment on the mitochondrial membrane potential (ΔΨm) in cultured neurons. (a) Representative images of neurons stained by JC-1. Red fluorescence represents JC-1 aggregates in healthy (polarized) mitochondria, whereas green fluorescence represents cytosolic JC-1 monomers released from mitochondria with depolarized membranes. (b) The ΔΨm of neurons in each group was calculated as the fluorescence ratio of red to green. Mean ± SEM. n = 3 per group. ∗P < 0.05 versus control group. #P < 0.05 versus t-BHP group. &P < 0.05 versus NSC-CM group.

