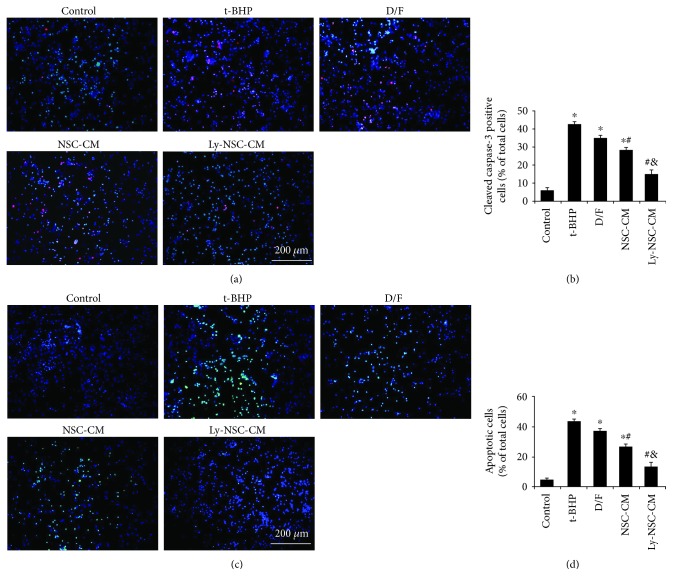
Figure 5.
Ly-NSC-CM protects cultured neurons against t-BHP-induced apoptosis. (a) Immunofluorescence imaging of neurons labeled with cleaved caspase-3 (red) and DAPI (blue). (b) Quantification of cleaved caspase-3 labeling. The histogram displays the proportion of cleaved caspase-3-positive cells (as a % of total cells) in each group. (c) Representative images of TUNEL-positive cells (green) and DAPI (blue). (d) Quantification of the TUNEL assay. The histogram displays the percentage of TUNEL-positive cells (as % of total cells) in each group. n = 3. Data are described as mean ± SEM. ∗P < 0.05 versus control group. #P < 0.05 versus t-BHP group. &P < 0.05 versus NSC-CM group.

