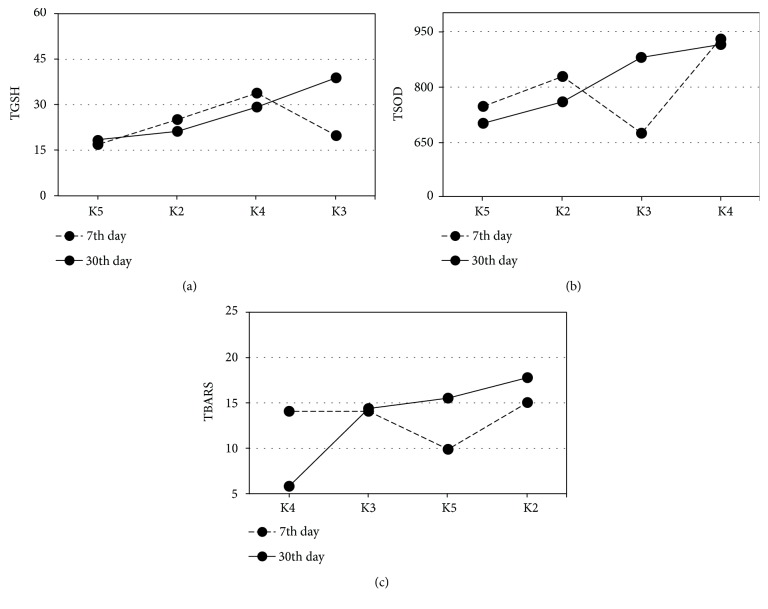
Figure 3.
GCF redox status of pre- and posttreatment period within the K2–K5 groups. Estimated marginal means for OS parameters at 7th and 30th day were evaluated with 0th day, in regard to Black's classification (K2–K5): (a) GSH covariates at the 0th day was 18.4 nmol TNB/mg proteins; significant difference was found in 30th day between K2-K3 (p = 0.001) and K3–K5 (p = 0.001); (b) tSOD covariate at the 0th day was 675.8 U SOD/mg protein; (c) TBARS covariate at the 0th day was 18.1 nmol MDA/mg proteins; significant difference was found in 30th day between K2 and K4 (p = 0.026). The patients' distribution across the 4 K groups is tabulated (Table 2). 7th and 30th days were presented with a dash and solid line, respectively. 2 × 2 between-group analysis of covariance (ANCOVA) and post hoc comparisons (least-significant difference (LSD)) was used. p ≤ 0.05 value was considered statistically significant.

