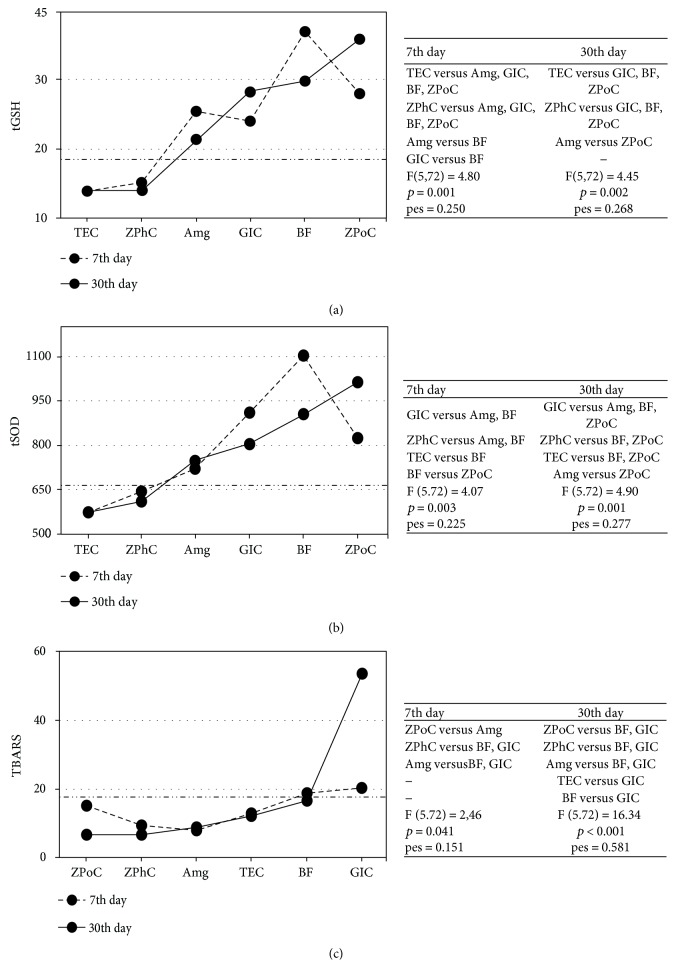
Figure 5.
The influence of the restorations on OS parameters before and after the treatments. Estimated marginal means for OS parameters in GCF at 7th and 30th day were evaluated with 0th day (horizontal line: long dash dot dot). In regard to the applied restorative, (a) GSH covariate at the 0th day was 19.3 nmol TNB/mg proteins; (b) tSOD covariate at the 0th day was 665.6 U/mg proteins; (c) TBARS covariate at the 0th day was 17.8 nmol MDA/mg proteins. The patients' distribution across the K groups and restorative groups is tabulated (Table 2). 7th and 30th days were presented with a dash and solid line, respectively. Tables on the right show differences (p values) in OS parameters between restoratives' treatment groups. pes: partial eta squared. 2 × 2 between-group analysis of covariance (ANCOVA) and post hoc comparisons (least-significant difference, (LSD)) was used. p ≤ 0.05 value was considered statistically significant.

