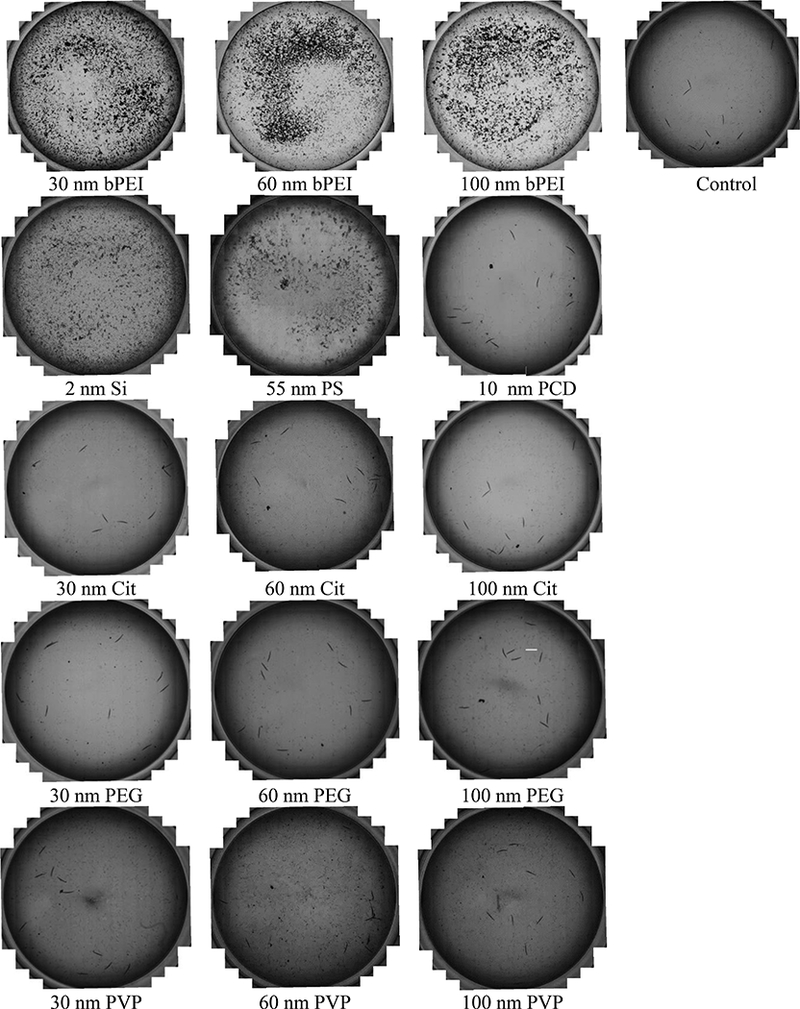
Figure 2.

During the ISO assay, positively charged ENPs produced large agglomerates on the bottom of the wells, and these agglomerates were not seen in wells containing neutral or negatively charged ENPs or in the negative control wells. The same concentrations were used for the different ENPs as were used in Figure 1. These images were taken of wells from the 12-well plates after conducting the ISO assay.
