
Figure 4.
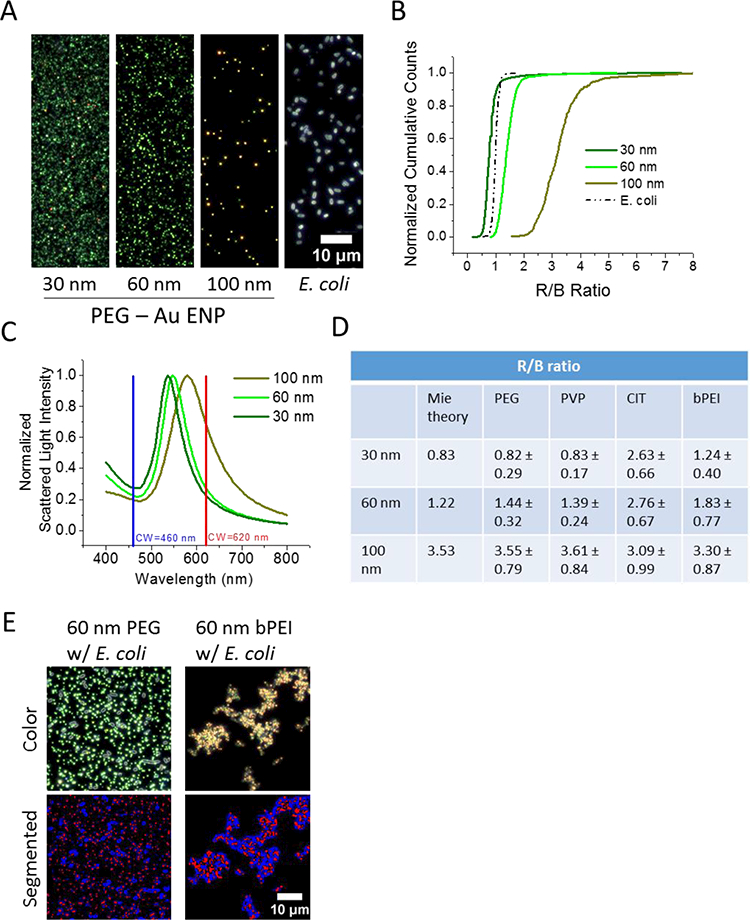
Enhanced darkfield imaging analysis using the ratio of the red (R) and blue (B) channels of a color CCD camera to distinguish between gold nanoparticles and E. coll in uniform and mixed solutions. A) Darkfield images of individual solutions of PEG coated Au ENPs (30 nm, 60 nm, and 100 nm in diameter) and E. coll. Thirty nm and 60 nm ENPs appear green, 100 nm ENPs appear yellow-orange, and E. coll appear white. B) Average R/B ratio for each particle is performed by image analysis and reported as a cumulative distribution plot for the image of PEG coated Au ENPs and E. coll bacteria. C) Mie theory calculation of Au ENP scattering as a function of wavelength for 30 nm, 60 nm, and 100 nm sized particles overlaid with the center wavelength for the R and B channels of color camera used for these experiments. D) Table of the R/B ratio values (± 1 standard deviation, n > 500 particles) for Au ENP sizes as calculated by Mie theory and measured for several Au ENP coatings: PEG, PVP, CIT, and bPEI. The measured R/B ratio for E. coll is 1.00 ± 0.11. E) Application of using the distinct R/B ratios for Au ENPs and E. coll measured in uniform solutions to segment the images of heterogenous combinations of Au ENPs and bacteria. For a representative non-agglomerated mixture: 60 nm PEG coated Au ENPs and E. coll shortly after mixing, a reference image is shown alongside a processed image where Au ENPs are colored red at R/B ratio of 1.44 ± 0.32 and bacteria are colored blue at R/B ratio of 1.00 ± 0.11. For a representative agglomerated mixture: 60 nm bPEI coated Au ENPs and E. coll after 24 h incubation, a reference image and processed image are shown where the processed image displays agglomerates containing red and blue coloration corresponding to R/B ratios for 60 nm bPEI Au ENPs and E. coll.