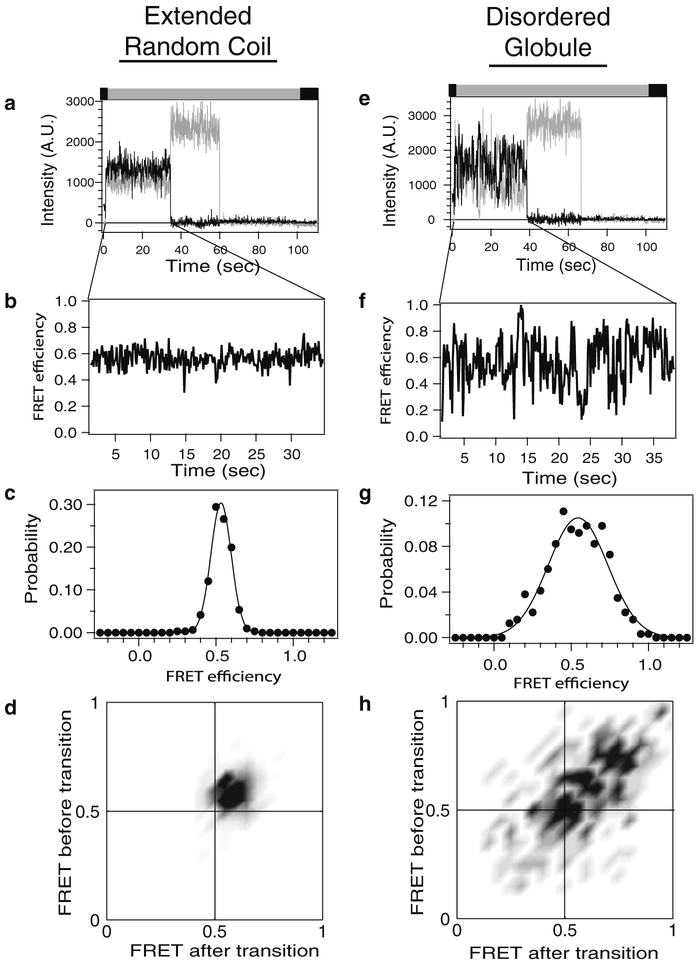
Fig. 5.
Analysis of single-molecule fluorescence intensity time traces. Representative data analysis is shown for two classes of IDP that have been labeled with donor and acceptor. Left: Extended random coil IDP. Right: Disordered globular IDP. (a and e) Background corrected fluorescence intensity of a single molecule. Donor emission is colored gray while acceptor is colored black. Note the single-step photobleaching of each dye to baseline, which confirms a single molecule. Colored bar above the panel describes the alternating laser excitation (see Note 7). (b and f) Intensities above have been converted to FRET efficiencies for the period before the acceptor dye molecule photobleached. Note the steady FRET of the random coil compared to the stochastic switching in a disordered globule. (c and g) FRET efficiency at each time point is compiled into histograms to examine the probability distribution. These histograms contain data from only one molecule, while a typical experiment would compile hundreds to thousands of molecules. Random coils give a single peak of shot noise-limited width. (d and h) The time series of changes in FRET are examined using transition density plots, which plot the FRET state before a transition (y-axis) against the FRET state after that transition (x-axis) for molecules (a) and (e), respectively. The darker areas indicate more favored transitions between the indicated FRET states. The random coils show only one peak while the globular IDP makes transition to many different FRET states.

