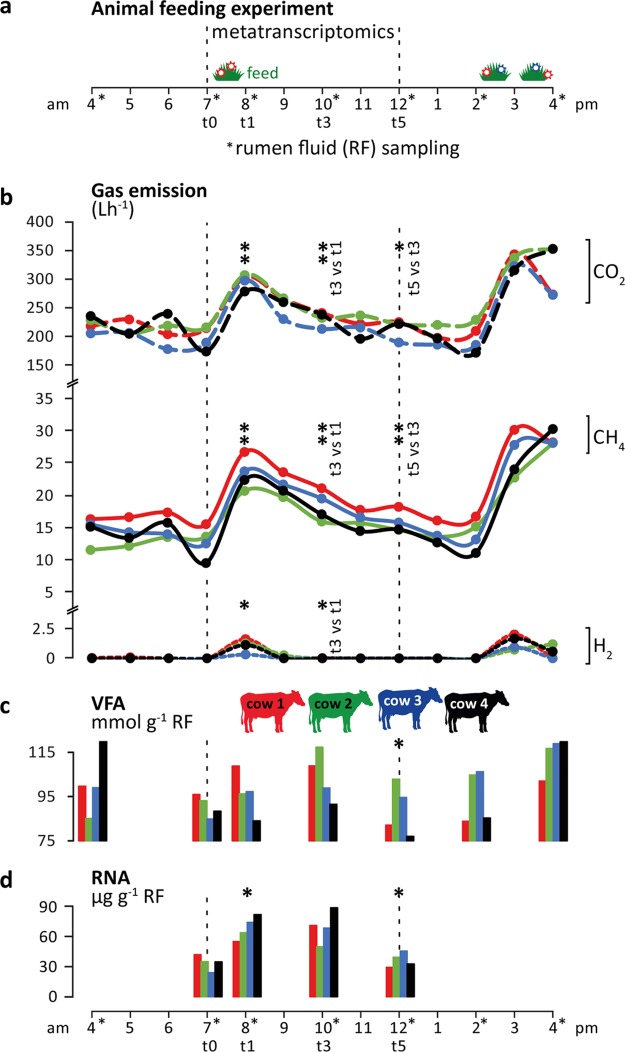
FIG 1 .
Ruminant gas emissions and volatile fatty acid (VFA) production. (a) Overview of the animal feeding trial during 12 h (4 a.m. to 4 p.m.) of sampling (for more details, see Materials and Methods). (b) Carbon dioxide (CO2), methane (CH4), and hydrogen (H2) emissions measured using open-circuit respiration chambers. (c and d) Total VFA concentrations (c) and total RNA content (d) quantified per gram of rumen fluid (RF). The color code indicates the four rumen-cannulated Holstein dairy cows. Bold asterisks indicate significant differences between the data for each respective time point and the previous one (*, P < 0.5; **, P < 0.01 [paired t test]).

