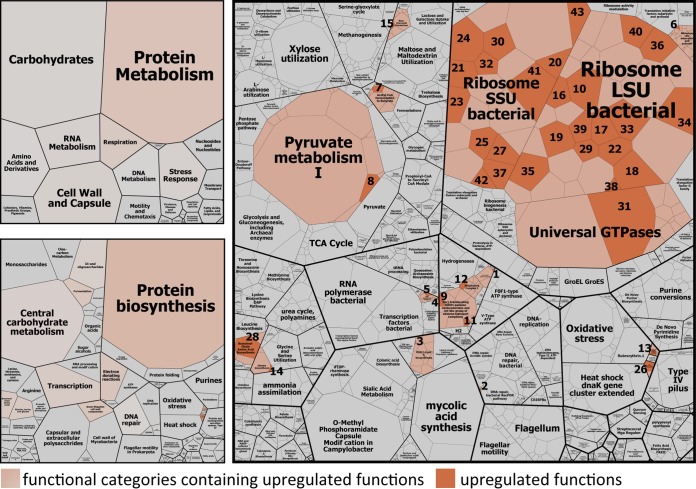
FIG 3 .
Global functional response of rumen microbiome to ruminant feed intake. Boxes show the mean relative abundances of all annotated mRNAs of eight rumen metatranscriptomes (t0 and t1 metatranscriptomes) in a hierarchical way. The color code indicates functional categories that were identified by differential gene expression analysis to be significantly higher expressed 1 h after the feeding (t1) than before the feeding (t0). The particular upregulated functions are colored in orange. All functions that were subjected to differential gene expression analysis are depicted (1,659 functions); low-abundance transcripts were excluded. For more details on the significantly higher expressed functions (e.g., functional assignment of the numbered tiles), see Table S5.

