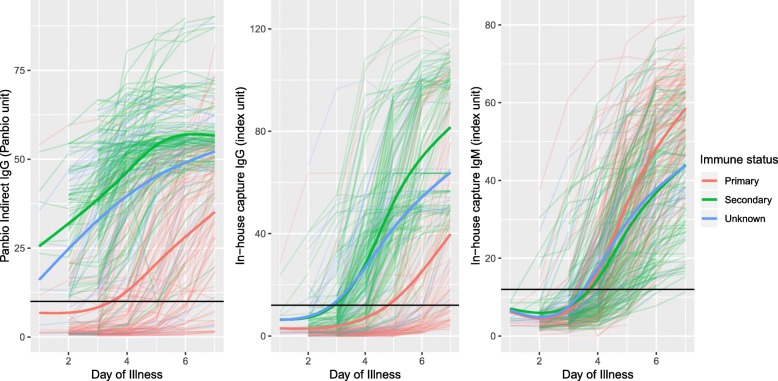
Fig. 2.
Antibody kinetics by immune status. Each thin line is an individual patient values, coloured by immune status group. The thick coloured line for each colour is the smoothed median for the relevant immune status group. The black horizontal lines indicate the cut-off for a positive result for each test

