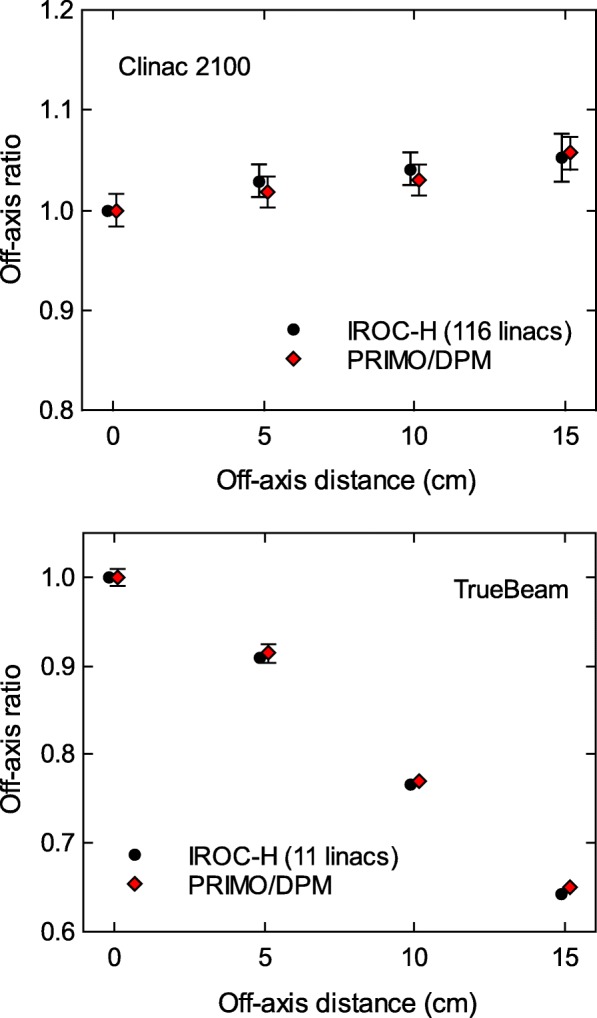
Fig. 2.

Off–axis ratios for a 40×40 cm2 field reported by IROC–H, and calculated with PRIMO using the DPM algorithm. The maximum differences between simulations and IROC–H data are − 1.1% for Clinac 2100, and 1.3% for TrueBeam. Uncertainty bars show (with k=2) the standard deviation of the IROC–H data, and the statistical uncertainty of the simulations. For some data points, the bars are smaller than the symbol size. Data points are artificially separated along the horizontal axis for clarity
