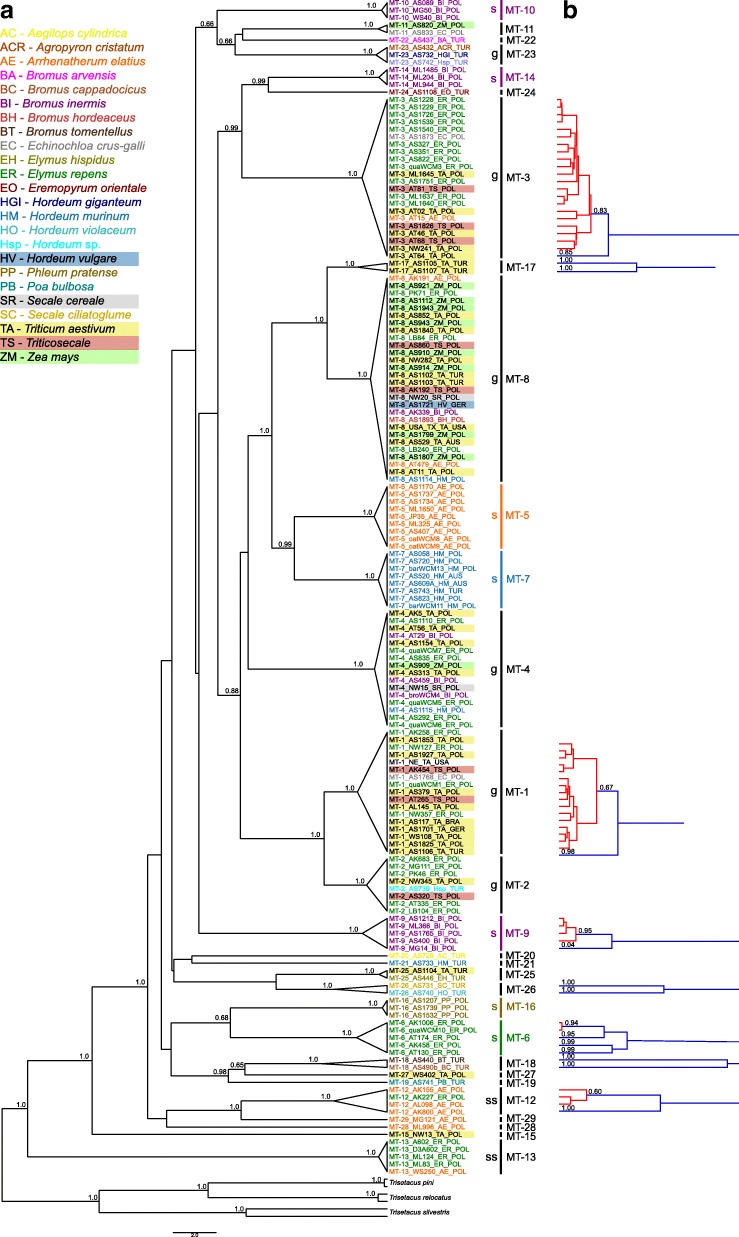
Fig. 1.
a Bayesian inference (BI) tree constructed using the GTR + G model for the cytochrome c oxidase subunit 1 (Cox1) sequences of the wheat curl mite (WCM) species complex and outgroup species. WCM individuals on the tree are colored according to their grass host species; color boxes correspond to cultivated grasses (cereals) and color labels correspond to non-cultivated grasses. Sequence labels correspond to data in Additional file 1: Table S1and include information about the host species and geographic locality. Vertical bars indicate particular WCM lineages, and these of strict specialists (s) are colored according to their specific host plants. Lineages associated with several hosts are designated as generalists (g), and lineages found on two hosts with higher prevalence on one of them are designated as semi-specialists (ss). Numbers above branches are Bayesian posterior probabilities; only values > 0.6 are shown. b Results of combined Poisson Tree Processes model for species delimitation (PTP) and a Bayesian implementation of PTP (bPTP) identifying additional putative species groups within MT-1, MT-3, MT-6, MT-9, MT-12, MT-17 MT-18, and MT-26 lineages. Blue lines indicate the unique species groups and red clades indicate species groups contained more than one haplotypes. Numbers above the branches are Bayesian posterior probabilities

