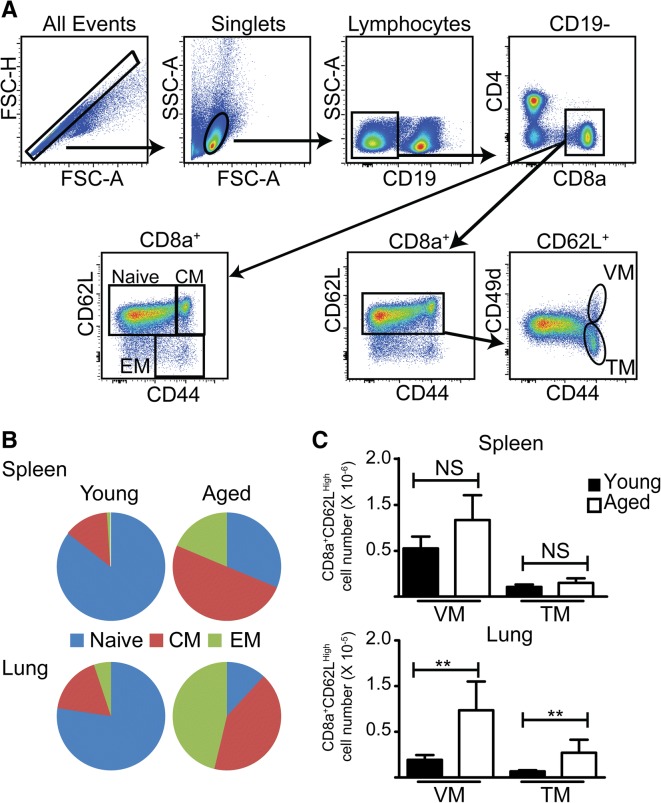
Fig. 3.
Distribution of peripheral CD8 T cells in naive young and aged mice. a Representative flow cytometry staining from spleen illustrating the gating strategy for identifying CD8 subsets in B and C. b The distribution of naïve (CD62LHigh/CD44LLow), CM (CD62LHigh/CD44High) and EM (CD62LLow/CD44High) in the spleen and lung of young (2–3 months) and aged (18–22 months) SPF mice. c The number of VM (CD49dLow) and TM (CD49dHigh) among the CM population in the spleen and lung of young and aged mice. Bars represent the mean ± SD. The data are from a single experiment, n = 5 mice/group, and are consistent with published data [42]. Data were analyzed by unpaired, two-tailed T test (**p < 0.01)

