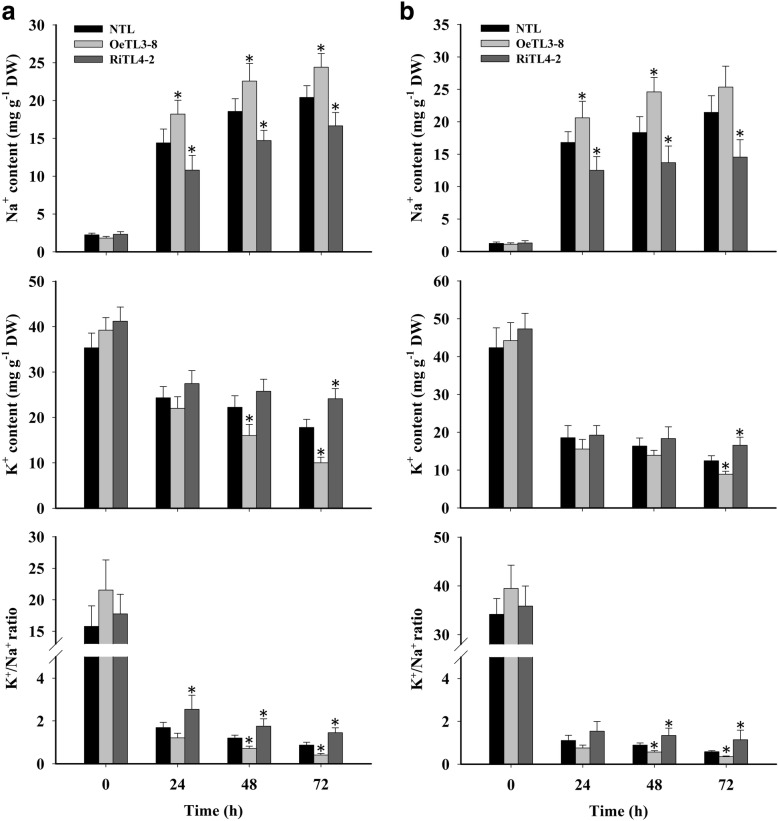
Fig. 4.
Na+ and K+ contents in shoots and roots of various rice plants under salt stress. Ion content in leaf (a) and root tissue (b) of four-week-old NTL, OeTL3–8 and RiTL4–2 plants exposed to salt stress (150 mM NaCl) for 72 h. Values shown are for Na+ and K+ together with changes in the K+/Na+ ratio over time. Sixty seedlings per genotype (twenty seedlings for each biological replicate) were used. Data shown are the means ± SE of three biological replicates. An asterisk indicates a significant difference (P < 0.05) versus stressed NTL

