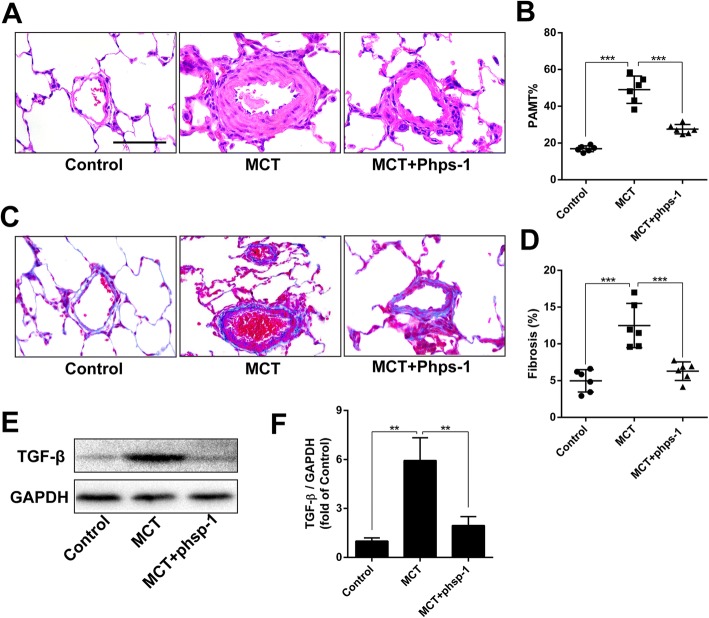
Fig. 2.
Shp2 inhibition attenuates MCT-induced thickening of PAMT and perivascular fibrosis. a Representative images of hematoxylin and eosin staining for PAMT, Scale bar = 30 μm. b Quantification of PMWT (n = 6 for each group). c Representative images of Masson’s trichrome staining for detecting perivascular fibrosis (blue), Scale bar = 30 μm. d Hemi-quantification of perivascular fibrosis (n = 6 for each group). e and f Phps-1 reversed MCT-induced overexpression of TGF-β in lungs (n = 3). Data was presented as means ± standard deviation (SD), ** P < 0.01 and *** P < 0.001

