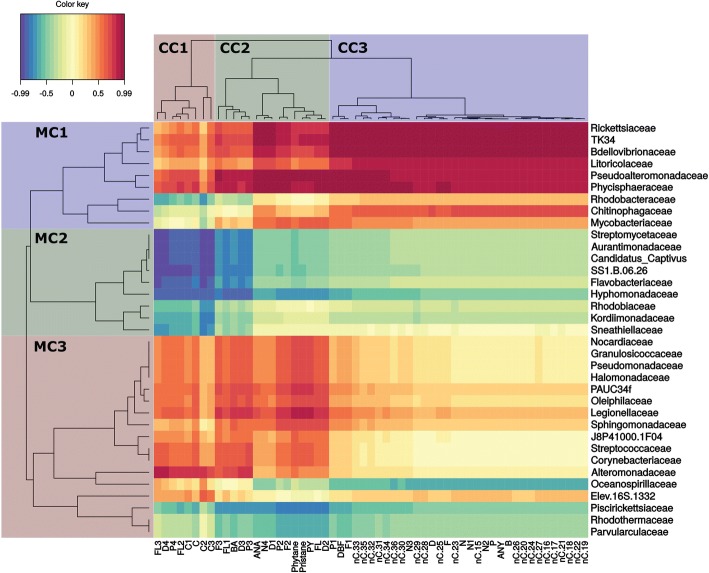
Fig. 6.
Troll oil at 5 °C. Heatmap clustering of individual target hydrocarbons based on modelled degradation curves and the mean relative abundance of microbial families. Red color indicates a strong positive correlation between hydrocarbon persistence and bacterial family and thus suggests that biodegradation is not corellated to that family. Blue indicates a strong negative correlation correlation between hydrocarbon persistence and bacterial family and thus suggests that biodegradation is corellated to that family. On the left, microbial clusters (MC) are grouped by color and identified as MC1, MC2, or MC3. Single compound clusters (CC) are also grouped by color and identified as CC1, CC2, and CC3. In single compound clusters (CC) n-alkanes are abbreviated by nC. acronym, followed by the number of carbon atoms describing the chain length. Abbreviations for aromatic compounds are further described in additional table (Additional file 3: Table S3)

