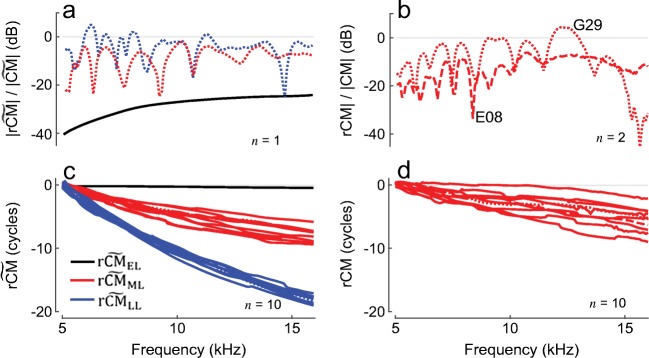
Fig. 10.
Examples of modeled (a, c) and measured (b, d) CM suppression residuals. Residual levels are expressed relative to corresponding smoothed probe-alone response levels. Exemplary residual CM levels measured in two chinchillas are shown in b (E08, G29) and 10 randomly chosen unwrapped phase functions are shown in d. Modeled CM residuals for early-, middle-, and late-latency CM components (black, red, and blue, respectively) are shown for one “ear” in a and 10 randomly chosen phase functions in c. The CM residuals were calculated as described in Charaziak et al. (2017). Attenuation with distance was assumed at a rate of 2 dB/mm, and BM displacement profiles for tone and saturator stimuli were modeled after 30- and 60-dB SPL responses from cochlea L208

