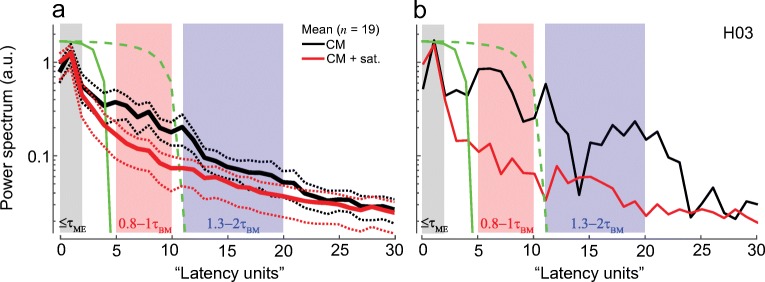
Fig. 2.
Chinchilla CM latency functions for signals measured with and without the saturating tone (red and black, respectively). Panel a shows mean (solid) latency functions together with 95 % confidence intervals (CIs, dotted, calculated through bootstrapping) for 19 animals, while b plots an individual example. The shaded boxes mark the ranges of latencies over which an artificial signal with the specified phase-gradient delay, τAS, exhibits significant peaks. The ranges are based on either middle ear (ME) or near-CF basilar membrane (BM) group delays (see description within each box). The solid green line shows the matched window duration used to separate putative early-latency from delayed CM components. The delayed CM components were subsequently unmixed into middle- and long-latency components using the second window (green dashed lines)

