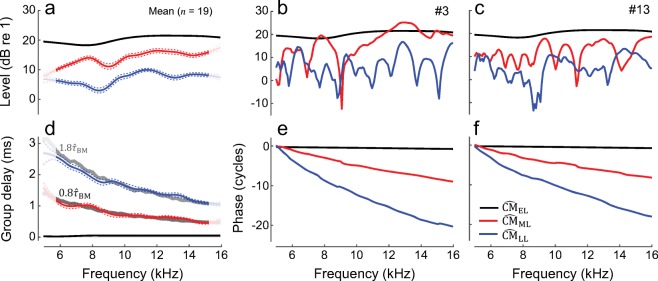
Fig. 5.
Model-predicted early-, middle-, and late-latency CM components are shown in black, red, and blue, respectively, averaged for 19 “ears” (a, d) and for example individual ears (b, c, e, f). To simulate the different “ears,” we used different roughness profiles while keeping all other model parameters unchanged. The mean values were gently smoothened by computing loess trend lines (solid), and 95 % CIs for the trend were calculated via bootstrapping (dashed), with loess edge effects estimated as 25 % of the span (lighter colors at the edges). The gray lines in d correspond to 0.8 and 1.8, where was calculated directly from simulated near-CF BM displacement phase gradients. Because the model is perfectly scaling symmetric (aside from end effects), the predicted diverges from the real ear delay estimates, τBM, toward lower frequencies, where deviations from scaling symmetry are more apparent

