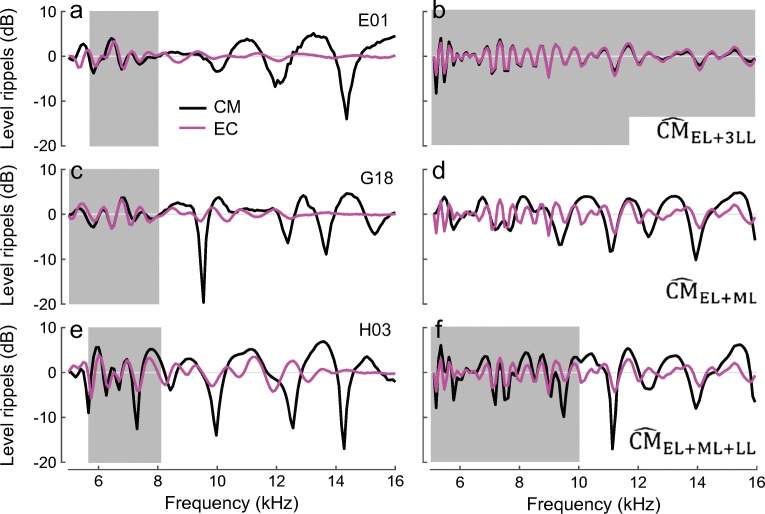
Fig. 9.
Spectral ripples in the total CM (black) and ear-canal pressure (EC, magenta) levels measured in three animals (a, c, e) and simulated for three different CM compositions (b, d, f). The level ripples were extracted as in Fig. 1. The gray boxes identify the frequency ranges where CM and EC ripples appear to be well correlated. The EC pressure was simulated as a mixture of constant stimulus pressure and SFOAE [with SFOAE(fp) ~ R(fp)(1 + Rs) and R given by Eq. (3)]. The CM at the RW was simulated as a mixture of different combinations of early-, middle-, and late-latency components, as indicated on each panel. Note that in b the relative magnitude of the late component was adjusted (increased threefold) to produce visible ripples in the total response. Because we employed a simplified version of Eq. (3) (see text), round-trip delays for the SFOAE and late-latency CM are overestimated in the simulations, resulting in generally closer spacing of the ripples compared to the data (e.g., magenta in a and b)

