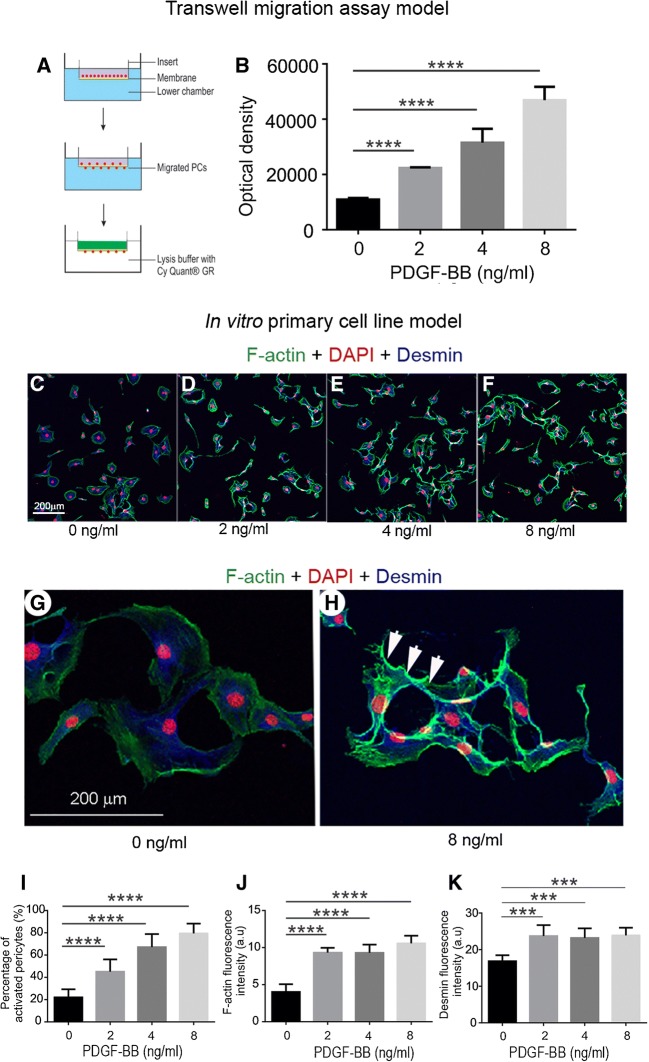
FIG. 3.
PDGF-BB promotion of pericyte migration was confirmed in in vitro models. (A) PDGF-BB-induced pericyte migration was tested in a transwell cell migration assay. (B) The level of pericyte migration was highly associated with the level of PDGF-BB [n = 6, F(3, 20) = 112, ****P < 0.0001, one-way ANOVA; ****P(2 ng/ml vs 0 ng/ml) < 0.0001, ****P(4 ng/ml vs 0 ng/ml) < 0.0001, ****P(8 ng/ml vs 0 ng/ml) < 0.0001] . (C–H) Pericytes were triple labeled with DAPI (red), Alexa 488 phalloidin for F-actin (green), and antibody specific for desmin (blue). Non-stimulated pericytes are large and flat with a fan-like morphology, as in (C). Stimulated pericytes are polarized with long, thin processes and relatively high fluorescence signal for F-actin, see also (D, E and F). (G and H) High magnification confocal projection images respectively show weak fluorescence signal for actin filaments in the non-stimulated pericytes (G) and increased fluorescence signal for F-actin filaments at the leading edge of cells stimulated by PDGF-BB (H, white arrows). (I–K) respectively show the degree of morphological change in pericytes [n = 20, F(3, 54) = 98.67, ****P < 0.0001, one-way ANOVA; ****P(2 ng/ml vs 0 ng/ml) < 0.0001, ****P(4 ng/ml vs 0 ng/ml) < 0.0001, ****P(8 ng/ml vs 0 ng/ml) < 0.0001], and the fluorescence level of expression of F-actin [n = 20,F(3, 20) = 53.5, ****P < 0.0001, one-way ANOVA; ****P(2 ng/ml vs 0 ng/ml) < 0.0001, ****P(4 ng/ml vs 0 ng/ml) < 0.0001, ****P(8 ng/ml vs 0 ng/ml) < 0.0001] and desmin [n = 20, F(3, 20) = 12.16, ****P < 0.0001, one-way ANOVA; ***P(2 ng/ml vs 0 ng/ml) < 0.001, ***P(4 ng/ml vs 0 ng/ml < 0.001, *** P(8 ng/ml vs 0 ng/ml) < 0.001]

