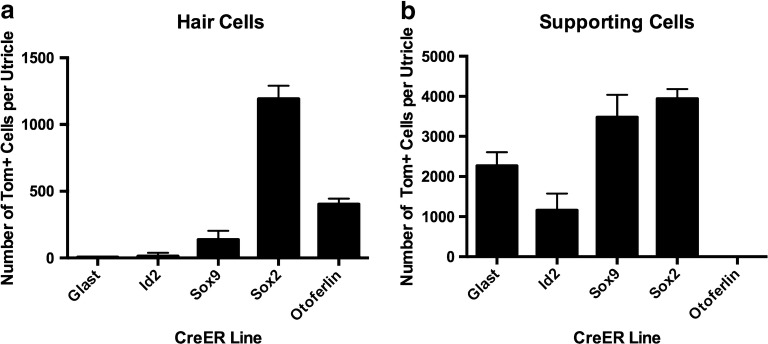
Fig. 8.
Graphs comparing Cre efficiencies in hair cells and supporting cells for several lines. Each column represents average number of tdTomato-labeled cells per utricle (+ 1 standard deviation) for hair cells (a) and supporting cells (b) from each CreER line. TdTomato-positive cells were quantified from two central regions and two peripheral regions, which together comprised 24 % of the total macula’s area. Conversion to number of labeled cells per utricle is described in the “Materials and Methods” section

