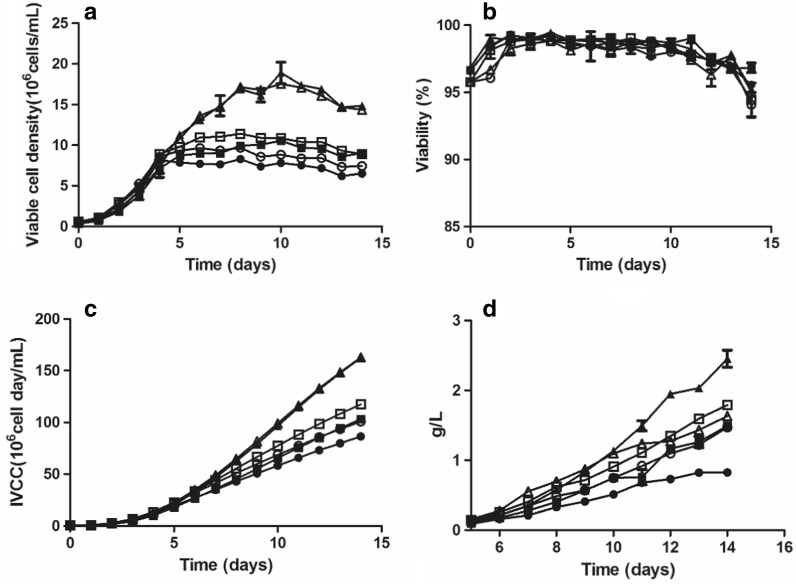
Fig. 1.
Profiles of a cell growth, b cell viability, c the integral of viable cell concentration (IVCC = ∫t0 Cxdt, Cx: Viable cell density), and d mAb production during fed-batch culture at different temperatures and with or without hydrolysate addition to the feed. Control group at 30 °C (open circles); control group at 32 °C (open squares); control group at 34 °C (open triangles); hydrolysate addition group at 30 °C (filled circles); hydrolysate addition group at 32 °C (filled squares); hydrolysate addition group at 34 °C (filled triangles). The error bars indicate the standard deviation of three independent experiments

