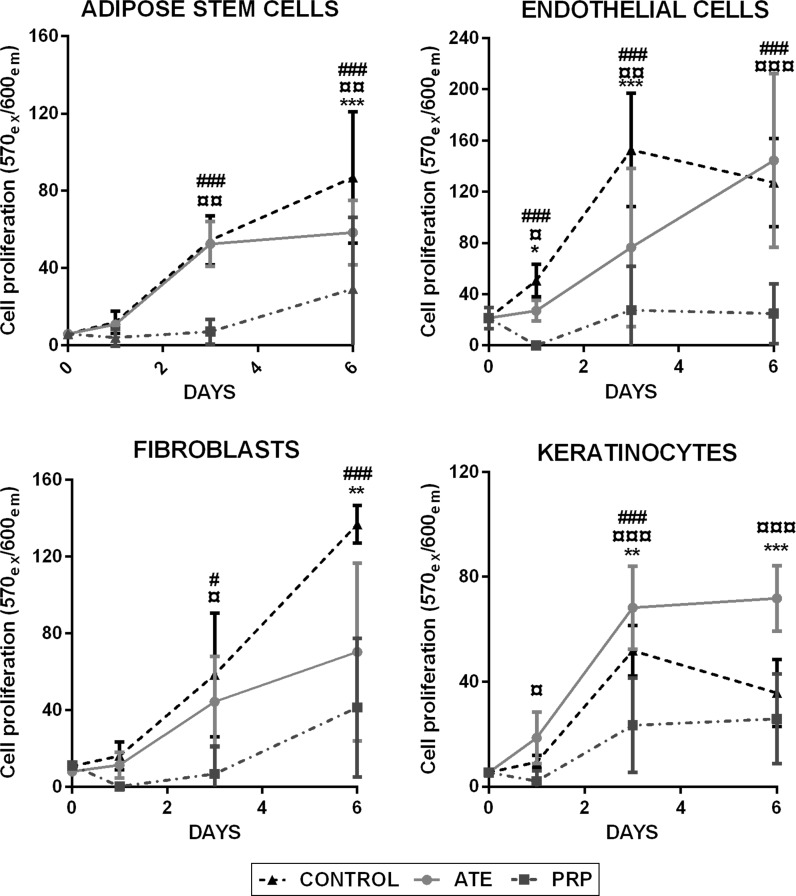
Fig. 2.
Cell proliferation of ATE and PRP-treated cultures of adipose stem cells, endothelial cells, fibroblasts and keratinocytes when compared to control. Proliferation was measured with Presto Blue from live cultures at days 0, 1, 3 and 6. Results are depicted as mean ± SD. The statistical analysis was performed with two-way ANOVA with Tukey’s post-test. Differences were considered significant when p < 0.05*, p < 0.01** and p < 0.001***. Significances between ATE and control group are shown with (*), significances between PRP and control group with (#) and significances between ATE and PRP with (¤). (Color figure online)

