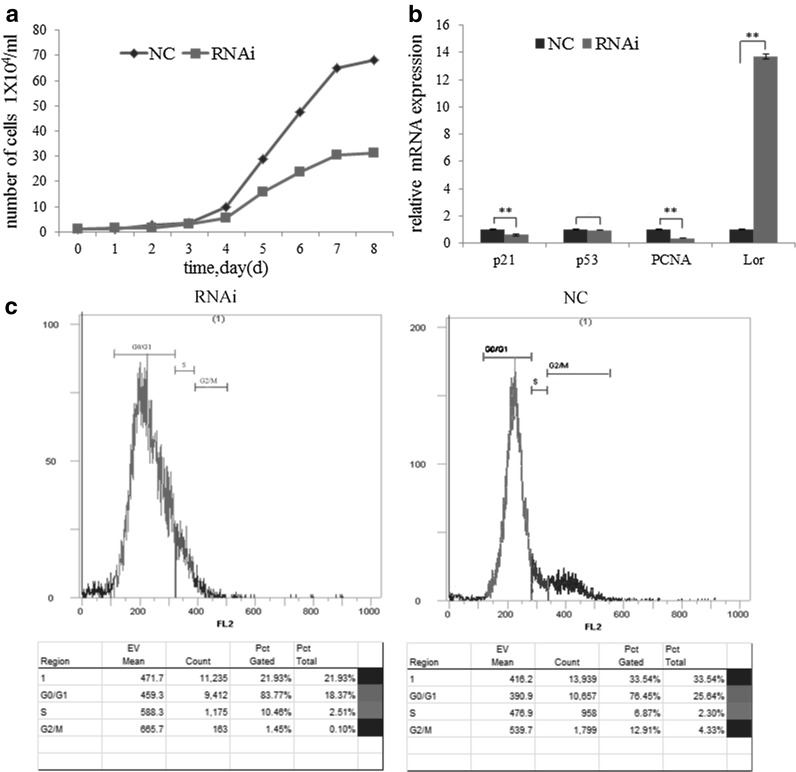
Fig. 3.
Effects of Sox9 on gHFSCs growth. a Cell growth curve. c Cell cycle detection. b Differential expression of p21, p53, PCNA and loricrin. Mean and standard deviation are shown (n = 3). p values from t-test: *p < 0.05; **p < 0.01, relative to NC. NC: gHFSCs that transfected with non-specific shRNA to provide a negative control; RNAi: gHFSCs that transfected with sox9 shRNA

