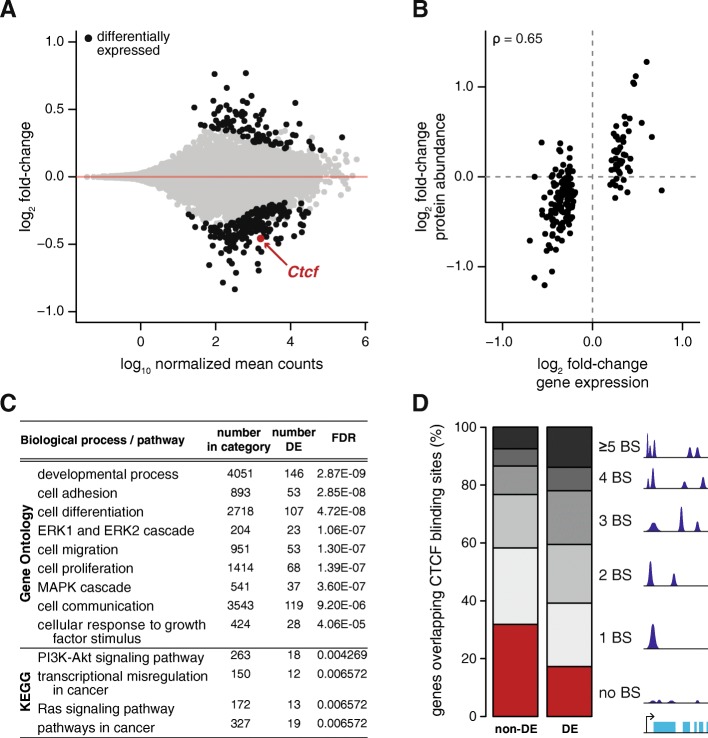
Fig. 4.
CTCF depletion dysregulates oncogenic pathways. a Nearly 300 genes are differentially expressed between wild-type and Ctcf+/− cells; significant changes are shown in black (FDR < 5%). b Transcriptional changes (x-axis) were highly correlated to corresponding changes at the protein level (y-axis); Spearman’s correlation coefficient is noted in the top left corner. Of all genes from a, 85% had concordant fold-change estimates in the proteomics dataset. c Gene set enrichment analysis performed on the differentially expressed (DE) genes highlights dysregulation of cancer related pathways. Representative significantly enriched terms from the Gene Ontology and KEGG pathways are shown. d Differentially expressed genes are strongly enriched for having higher numbers of CTCF binding sites (BS) than genes with stable expression, in their gene bodies or flanking 5 kb

