Fig. 5.
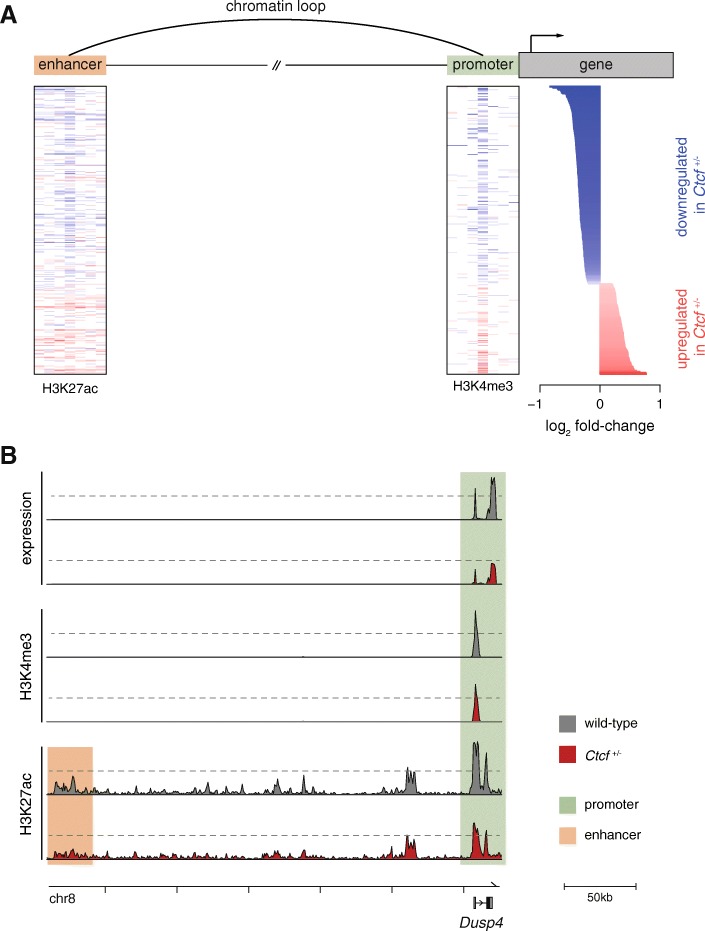
Transcriptional perturbations arise from regulatory changes in the nuclear genome. a Changes in expression of dysregulated genes are accompanied by changes in the activity of their proximal promoters, as well as enhancers linked via chromatin loops. On the right the expression differences between wild-type and Ctcf +/− cells are shown, ordered by increasing fold change; genes expressed at lower levels in the hemizygous cells are in blue, whereas those expressed higher are in red. To the left, a heatmap of the difference in mean abundance of H3K4me3 occupancy is shown. Each column is a 5 kb window, extending 17.5 kb up- and downstream of each gene’s transcription start site, which is in the center. On the far left, an equivalent heatmap for the difference in occupancy of H3K27ac, centered at the midpoint of the peak. Gene–enhancer pairs were inferred from significant interactions identified from Hi-C data and thus elements can be separated by large distances. For each gene, the enhancer with most regulatory potential is shown (“Methods”). The same color scale is used throughout. b Transcriptional changes are accompanied by concordant changes in the activity of their regulatory elements. In Ctcf hemizygous cells there was reduced gene expression of Dusp4, lower occupancy of promoter marks (H3K4me3 and H3K27ac), and reduced binding at the associated enhancer element (shaded boxes). Two representative replicates of equivalent sequencing depth are shown for each dataset

