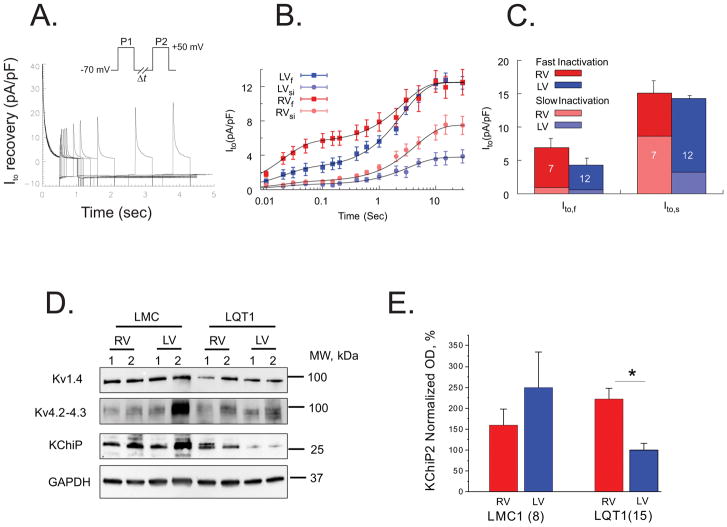
Figure 4.
Ito recovery from inactivation. A) The recovery kinetics was tested by a double-pulse protocol with interpulse time varying from 50 ms to 15 sec (n=12 RV and 7 LV cells from n=3 hearts). B) The amplitudes of the slow and fast inactivating components of Ito (Ito,si and I Ito,fi) as a function of inter-pulse interval were determined by fitting the time course of Ito decay during the second pulse to a double exponential function. The x-axis of inter-pulse intervals is in a logarithmic scale. C) The amplitudes of Ito,fi and Ito,si from RV and LV. Fast and slow-inactivating components (Ito,fi and Ito,si) of each Ito,f and Ito,s were calculated as described in Methods and represented as a stacked column plot. D) Western blots of Kv4.2, Kv1.4, and KChIP2 from LQT1 hearts. E). The accessory unit of Ito, KChIP2, known to affect inactivation and recovery kinetics, was twofold higher in RV (ANOVA, p < 0.05). The currents were measured under 50 nM isoproterenol. Additional Kv4.2 and Kv1.4 gel analyses are provided in the supplemental material.

