Figure 7.
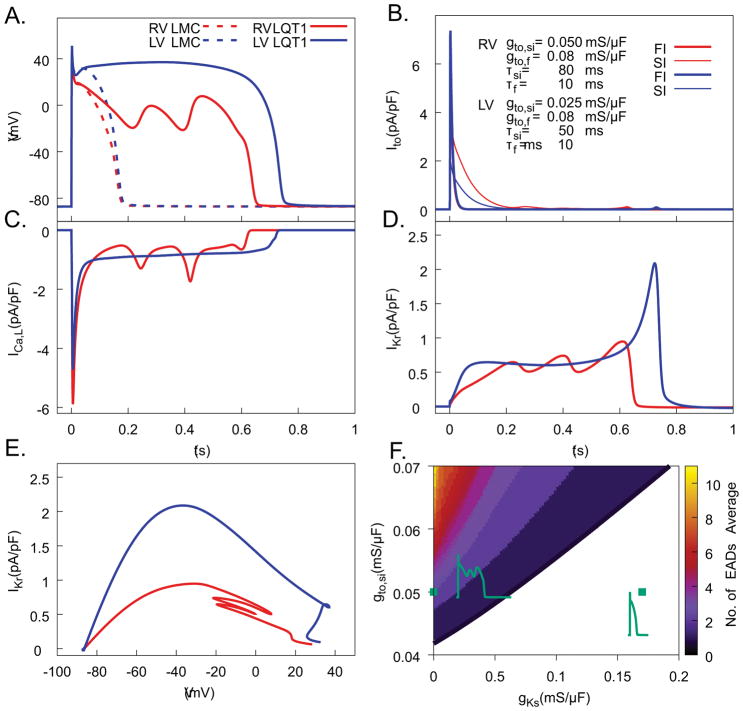
Computer modeling study of EADs reproduces Ito-dependent EADs in LQT1 myocytes under isoproterenol stimulation. A) Computed Vm traces for different Ito model parameters fitted to voltage-clamp measurements of Ito in RV and LV cells of LQT1 and LMC rabbits. Only RV (red) from LQT1 demonstrated EADs. B) Ito traces broken into fast-inactivating component (red in RV, dark blue in LV) and slowly inactivating component (orange in RV, light blue in LV) for action potentials in panel A. C) ICaL from RV (red) and LV (blue) during action potentials in panel A. D) IKr during action potentials in panel A. E) Dynamic I–V curves showing IKr during repolarization as a function of Vm. Note that in the range of Vm oscillations during EADs, IKr from RV (red) is markedly lower than LV (blue). F) EAD formation in the parameter space of Ito,si conductance (gto,si, Y axis) vs. IKs conductance (gKs, X axis) with and other parameters gto,fi = 0.074 mS/μF, τsi = 69 ms, and τfi = 8.5 ms. Representative AP traces within each region are shown, with parameters indicated by green diamonds. The right-most green diamond corresponds to parameters representative of LMC cells.

