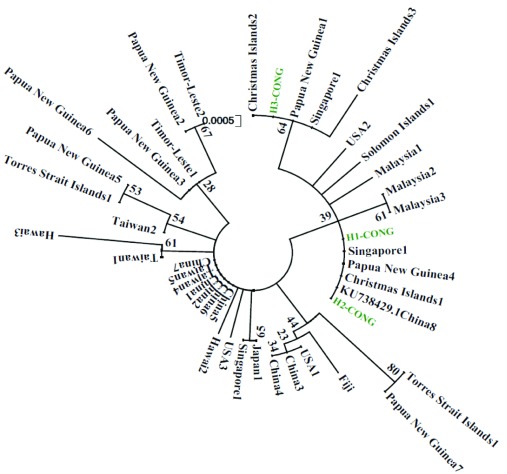
Figure 3. Molecular phylogenetic analysis using the Maximum Likelihood method.
The evolutionary history was inferred using the Maximum Likelihood method based on the Tamura 3-parameter model. The tree is drawn to scale, with branch lengths measured in the number of substitutions per site. There was a total of 445 positions in the final dataset.

