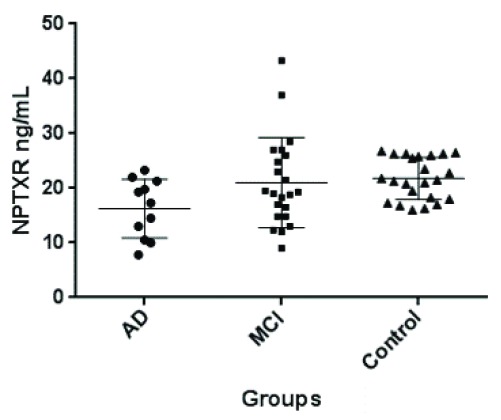
Figure 6. Distribution of CSF NPTXR concentrations, as measured by ELISA, in CSF of patients with Alzheimer’s disease (AD; n=12), mild cognitive impairment (MCI; n=21) and controls (n=23).
The differences were statistically significant only between controls and AD patients by Mann-Whitney test (p=0.004). Horizontal lines represent means and 25–75 percentiles. This cohort has been described elsewhere 19. For more details see text.

