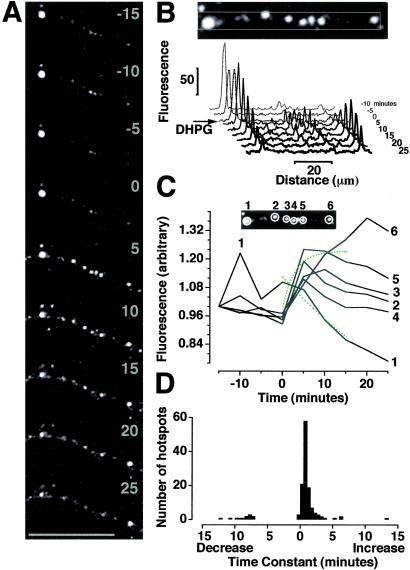
Figure 4.
DHPG-stimulated synthesis of GFP protein at specific sites along isolated dendrites. (A) Enlarged images of dendrite from black box in Fig. 1B during time course [(5-min intervals) Bar = 50 μm.] showing example hotspots analyzed in B and C. (B) Profile plots through reoriented images of dendrite displayed in A, as examples of hotspots analyzed in D. (Inset) Line of the profile plot across hotspots. Fluorescence range 0–255: 0 = black, 255 = saturated. (C) Examples of hotspots analyzed in D. (Inset) ROIs (white circles) were applied to fluorescent hotspots, and the mean fluorescence intensity per pixel in each ROI was measured across time. (Graph) Time course of hotspot fluorescence as a proportion of that at t0 (——) with exponential curves applied to hotspots 1 and 5 (- - - -). (D) Histogram of time constants for exponential curves applied to fluorescence time courses for ROIs (such as those in C) around 134 hotspots displayed in Fig. 1.

