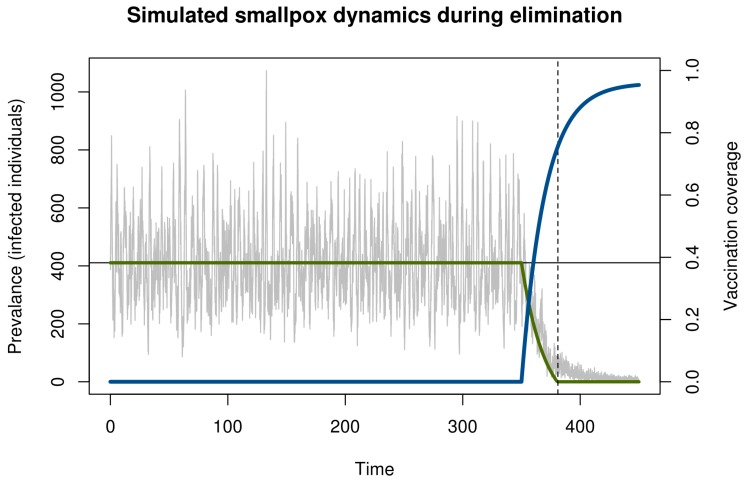
Figure 1.
Simulation of smallpox elimination through vaccination. The gray line shows the number of infected individuals over time. The blue line shows vaccination coverage, which approaches a maximum at 0.96. The green line shows the deterministic equilibrium that would be achieved if the vaccination rate was held constant and the time-dependent value. Disease dynamics are given by a stochastic SIR model with states S, I, and R for the number of susceptible, infected, and immune persons, respectively; mean field equations dS/dt = μ(S + I + R)(1−ρ) − βSI/(S + I + R) – ξS − μS, dI/dt = βSI/(S + I + R) + ξS − μI − γI, and dR/dt = γI + μ(S + I + R)(ρ) − μR; and parameters for transmission β = R0(γ + μ) ≈ 121.7, recovery γ = 365/12 ≈ 30.4, demography μ = 1/60, externally acquired infection ξ = 0.001, speed of vaccination roll out σ = −0.05, maximum possible vaccination coverage a = 0.96, and time that vaccination begins s = 100. All rates are in units of years. The function ρ(t) = a(1 − exp[σ(t − s)]) is the time-dependent vaccination rate. Total population size in this simulation was 100,000 individuals. Solutions were obtained using the adaptive tau-leaping algorithm [25]. Parameters follow Ferguson et al. [26].

