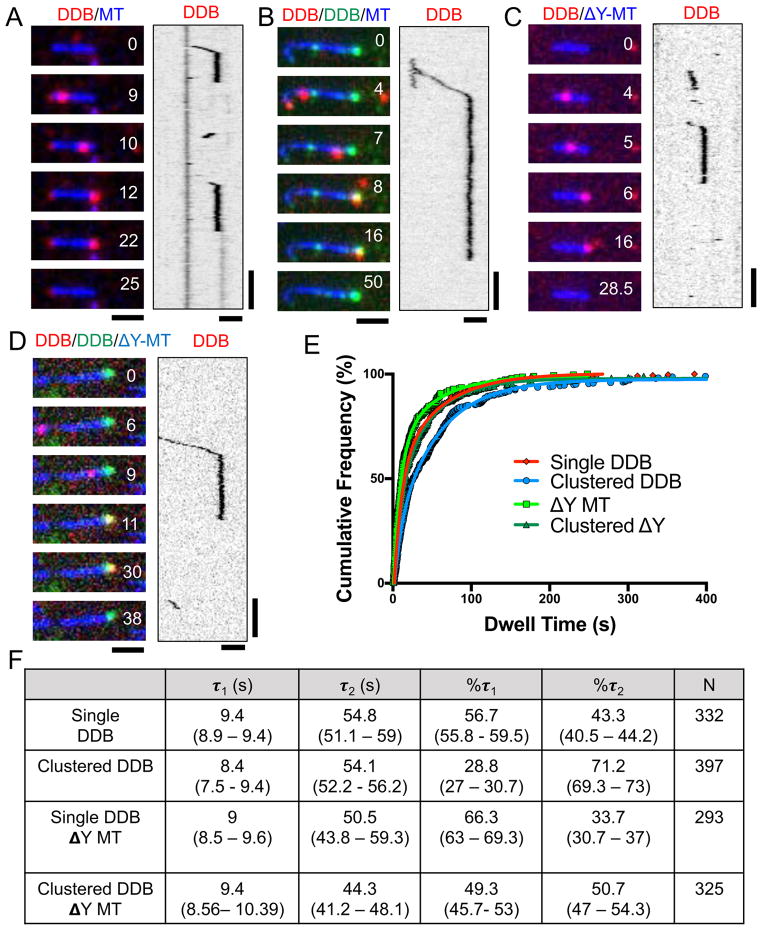
Figure 2. Single Molecule Analysis of DDB Dwell Times at MT Minus-Ends.
(A) Representative TIRF-M images and associated kymographs of DDB (red) behavior at MT (blue) minus-ends. (B) Representative images and associated kymograph of single molecule spiking experiments at ~1 nM SNAP-TMR DDB (red) and ~30 nM SNAP-488 DDB (green) dwelling at MT minus-ends (blue). (C) Representative images and associated kymograph of DDB (red) dwelling at the ends of carboxypeptidase treated MTs (blue). (D) Representative images and associated kymograph of single molecule spiking experiments with ~1nM SNAP-TMR DDB (red) and ~30 nM SNAP-647 DDB (green) on carboxypeptidase treated MTs (blue). Time is given in sec. for A–D. Scale bars: 2 μm and 15 sec. (E) Cumulative frequency plots of DDB dwell times from the conditions in A–D. Solid lines are two-phase exponential regressions to the data. (F) Table summarizing the parameters of DDB cumulative frequency graphs, including the characteristic dwell time (τ) of short (τ1) and long (τ2) populations, percentage of molecules in each population, and number of molecules measured (N) are given. 95% confidence intervals given in parentheses. All regressions have a goodness of fit (R2) greater than .99. All data from 2–3 independent experiments.

