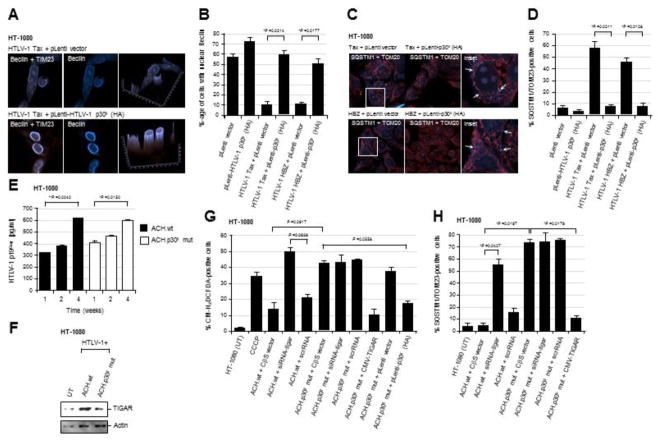
Fig. 2.
The HTLV-1 p30II protein prevents Tax/HBZ-induced oxidative damage and mitophagy, dependent upon TIGAR functions. (A and B) HT-1080 cells expressing the HTLV-1 Tax or HBZ oncoproteins were transduced with an empty pLenti vector or lentiviral-HTLV-1 p30II (HA-tagged) expression vector. The samples were then fixed and immunostained to visualize the TIM23 (red signal) and Beclin-1 (blue signal) proteins by confocal microscopy. Beclin-1 was present within cytoplasmic autophagosomal vesicles that colocalized with mitochondria (TIM23-labeled structures) in the cytoplasm of Tax or HBZ-expressing cells transduced with the empty vector. However, lentiviral HTLV-1 p30II inhibited Tax- and HBZ-induced autophagy/mitophagy and correlated with the predominantly nuclear distribution of Beclin-1. The graphs in A (right panels) give a three-dimensional representation of the subcellular distributions of TIM23 and Beclin-1 in the micrographs shown. The data in B show the percentages of cells with nuclear Beclin-1 and represent the mean ± standard deviation (error bars) from three independent experiments. (C and D) HT-1080 cells expressing HTLV-1 Tax or HBZ were transduced with an empty pLenti vector or lentiviral-HTLV-1 p30II (HA) particles, and then fixed and immunostained to detect TOM20 (red signal) and the mitophagy marker SQSTM1 (blue signal) by confocal microscopy. The arrows in the enlarged inset images at right indicate SQSTM1-positive mitophagic structures in the Tax or HBZ-expressing cells transduced with the empty vector. The data in D show the relative percentages of SQSTM1/TOM23-positive cells and represent the mean ± standard deviation (error bars) from three independent experiments. (E) The transiently-amplified, infectious HT-1080/HTLV-1 ACH.wt and ACH.p30II mutant proviral clones were serially passaged over 4-weeks and the release of extracellular HTLV-1 particles into the culture supernatants was measured, relative to a p19Gag protein standard, by performing Anti-HTLV-1 p19Gag ELISAs (Zeptometrix). (F) The relative expression of TIGAR protein in the HT-1080/HTLV-1 ACH.wt and ACH.p30II mutant proviral clones was detected by SDS-PAGE and immunoblotting. Actin levels are shown for comparison. (G) The production of intracellular ROS in the HT-1080/HTLV-1 ACH.wt and ACH.p30II mutant clones transfected with siRNA-tigar, a scrRNA negative control, or empty CβS vector was detected using the fluorescent chemical ROS-probe, CM-H2DCFDA, and then quantified by fluorescence-microscopy. CCCP was included as a positive control. The phenotypic impairment of cells containing the ACH.p30II mutant provirus was rescued either through transfection with pcDNA3.1-FLAG-TIGAR, or transducing them with lentiviral-HTLV-1 p30II (HA), as compared to an empty lentiviral vector. (H) The levels of oxidative damage and mitophagy in the HT-1080/HTLV-1 ACH.wt and ACH.p30II mutant proviral clones were determined using immunofluorescence-confocal microscopy to quantify the relative percentages of SQSTM1/TOM20-positive cells. The effects of inhibiting TIGAR expression were determined by transfecting these cells with siRNA-tigar or a scrRNA negative control. The overexpression of TIGAR (through transfection with pcDNA3.1-FLAG-TIGAR) significantly countered the mitochondrial oxidative damage in the ACH.p30II mutant clone. All the data is representative of at least three independent experiments. The data in E, G, and H represent the mean of the experiments ± standard deviation (error bars).

