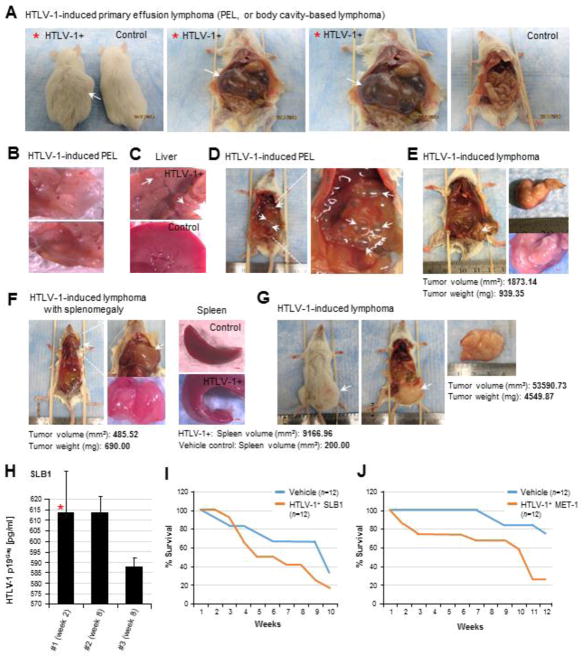
Fig. 5.
Tumor development and secondary organ-involvement in an in vivo xenograft model of HTLV-1-induced T-cell lymphoma. (A–G) Immunocompromised NOD/scid mice (12 animals per sample group, n=12) were anesthetized by gas inhalation with 3% isoflurane/O2 and then intraperitoneally engrafted with the tumorigenic HTLV-1-transformed T-cell lymphoma cell-lines, SLB1 or MET-1, in 500 μl of the vehicle (i.e., calcium/magnesium-free phosphate buffered saline, pH 7.4) using a 27-gauge tuberculin syringe. As a negative control, one group of animals (n=12) was injected with the vehicle alone. The animals were monitored for 8–12 weeks for signs of tumor growth (e.g., abdominal distension or the visible formation of masses) or changes to their overall health status. Following 2-weeks and every 2-weeks thereafter, the experimental animals were anesthetized and 75 μl of blood was collected from the facial vein using a sterile No. 2 lancet. The animals were eventually sacrificed and necropsies were performed to harvest and analyze tumor tissues and any affected secondary organs (e.g., spleen, liver, and pancreas). Several experimental animals exhibited abdominal distension (left panel in A) associated with the development of HTLV-1-induced primary effusion lymphomas (PEL), or body-cavity-based lymphomas (arrows in A and D). The PEL tumors were highly vascularized (B); and we also observed abnormal growths on the livers of some animals with HTLV-1-induced PEL (arrows in C). (E–G) Many animals engrafted with either the HTLV-1-transformed SLB1 or MET-1 cells developed solid T-cell lymphomas (arrows in E, F, and G), which were occasionally accompanied by enlargement of the spleen (lower right panel in F) and/or liver. (H) Representative results are shown for Anti-HTLV-1 p19Gag ELISAs (Zeptometrix) performed on three different SLB1-engrafted animals to measure their relative plasma loads of infectious HTLV-1 particles present in the circulating blood at the indicated time-points, as compared to a p19Gag protein standard. The red asterisk indicates the same animal as shown in A. The data in H represent the mean ± standard deviation (error bars) from three independent Anti-HTLV-1 p19Gag ELISA experiments. (I and J) Kaplan-Meier survival plots are shown for experimental NOD/scid animals that were intraperitoneally engrafted with 5×10⁵ of the HTLV-1-transformed SLB1 (I) or MET-1 (J) lymphoma cells, as compared to the Vehicle control group (n=12 for each sample group).

