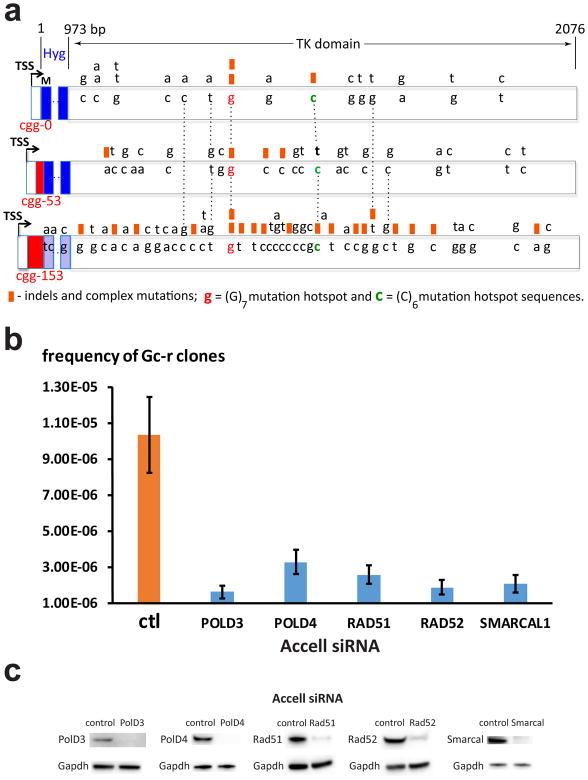
Figure 2. Mechanisms of ganciclovir-resistance.
a. Loss of function mutations in the HyTK gene leading to Gc-r. DNA bases from the wild-type HyTK gene that underwent mutagenesis are shown inside boxed areas of different cassettes. Distances from the 3′ end of the (CGG)n run are shown at the top. Dashed vertical lines align identical positions. Black arrows show transcription start sites (TSS), red rectangles represent (CGG)n repeats, M stands for translation initiation codon, blue rectangles demarcate the Hy domain. Point substitutions are written above the wild-type DNA bases; orange squares above the wild-type DNA bases designate indels or complex mutations. b. Frequencies of Gc-r clones in the c3-1 cell line carrying FMR1-CGG153-HyTK cassette in the A orientation (Table 1) upon treatment with siRNA targeted against genes implicated in BIR. Means and standard deviations from 4 independent experiments are shown. c. Inactivation of mouse POLD3, POLD4, RAD51, RAD52 and SMARCAL1 genes by Accell siRNAs. Western blot analyses with specific antibodies show dramatic reductions in the expression levels of the corresponding proreins. Protein levels for GAPDH gene are shown as internal control. Source data for c are available online.

