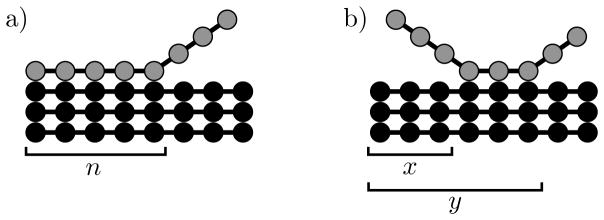
Figure 2.
Cartoon of the two H-bonding models used in the calculations. a) The zipper model has a single reaction coordinate n that describes the number of H-bonds formed. Bonding begins on the left and progresses toward the right. The molecule unbinds when n = 0. b) In the two-dimensional model bonds can be broken at either end of the chain. A configuration is described using two reaction coordinates; x is the number of broken H-bonds on the left, and y is the position of the last formed H-bond on the right. The molecule unbinds when x = y and the fully bound state is when x = 0, y = L.

