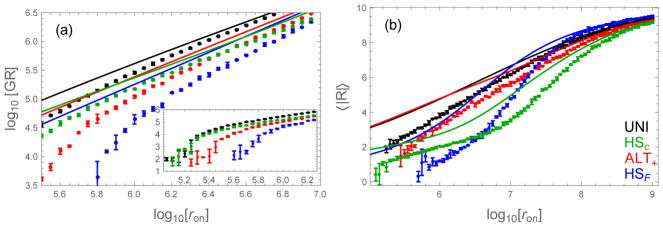
Figure 9.
Comparison of the fibril growth rate and average registry computed by Eq. (28) and Eq. (29) (lines) and Gillespie simulation (dots). (a) Growth rate (molecules per second) as a function of the diffusion-limited binding rate. The theory, while quantitatively inaccurate, correctly predicts changes in the ranking of sequences as a function of concentration. (inset) The low concentration regime shows a sharp increase in the growth rate at the solubility concentration. (b) The theory also does a good job of predicting the relative order of average registries, even at low concentration. The HSF has the most ordered fibrils at low concentration (small ron), but becomes less ordered than the other sequences at high concentration when large registry mismatches become more common. These large mismatches promote binding events between H residues at opposite ends of the triblock. Error bars show the standard deviation from three simulations. ε0 = 0.5, δ = 0.3

