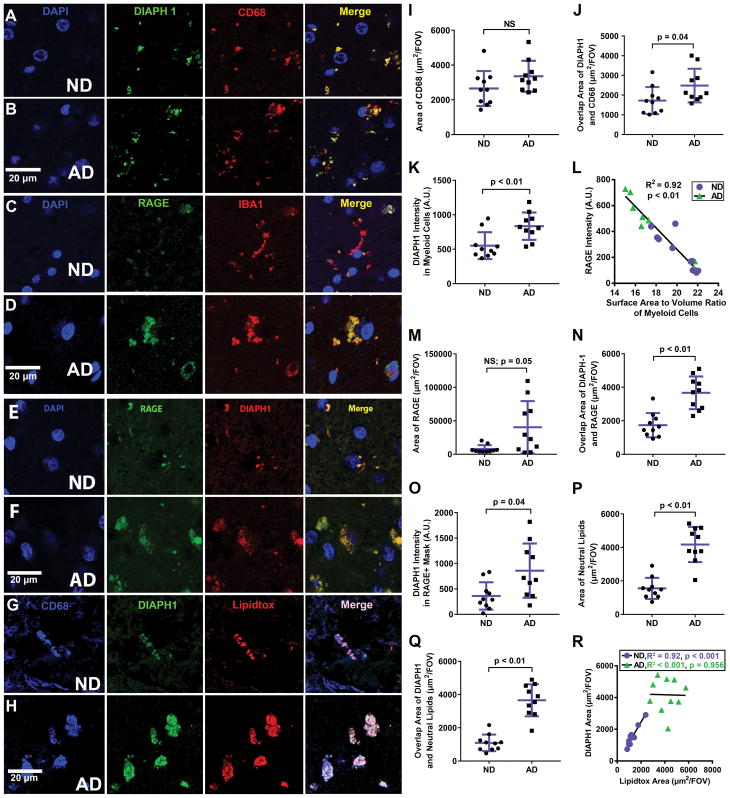
Figure 3. DIAPH1 and RAGE are Highly Expressed in Myeloid Cells in the Brain with Disease-State Specific Patterns.
All panels contain representative human temporal cortex 40 μm thick slices stained as labeled and imaged at 63x by 2D and 3D confocal microscopy. (A) and (B): DIAPH1 (green) and CD68 (red) with DAPI (blue) immunohistochemistry to analyze DIAPH1 in myeloid Cells. (C) and (D): RAGE (green) and IBA1 (red) with DAPI (blue) immunohistochemistry to analyze RAGE in myeloid cells. (E) and (F): DIAPH1 (green) and RAGE (red) with DAPI (blue) immunohistochemistry to illustrate high degree of overlap between the two molecules. (G) and (H): DIAPH1 (green) and Lipidtox (red) with DAPI (blue) immunohistochemistry to illuminate increased lipid burden in AD vs. ND brain and high degree of colocalization of DIAPH1 and neutral lipids in the AD and ND brains. (I–T): Quantification of representative images of immunohistochemistry staining. (I): Quantification of CD68 area shows a non-significant trend for increased CD68+ area in AD brain vs. ND brain. (J): Overlap Area of CD68 and DIAPH1 is high in both ND and AD conditions, and increased even further in AD brain vs. ND brain. (K): DIAPH1 intensity in areas of overlap between DIAPH1 and CD68 is significantly higher in AD vs. ND conditions. (L): Quantification of SA:V ratio in 3D Z-stacks displayed as 2D renderings in (E) and (F) reveals a strong, negative correlation between SA:V ratio and RAGE intensity in DIAPH1+ cells; purple circles = ND and green triangles = AD. (M): Quantification of RAGE area reveals a trend towards increased RAGE Area in AD brain vs. ND brain. (N): Overlap Area of RAGE and DIAPH1 is high in both ND and AD conditions, and increased even further in AD brain vs. ND brain (O): DIAPH1 intensity in areas of overlap between DIAPH1 and RAGE is significantly increased in AD brain vs. ND brain. (P): Area of Neutral Lipids is significantly decreased in AD brain vs. ND brain. (Q) Overlap Area of DIAPH1 and Neutral Lipids is increased in AD vs. ND conditions. (R): Linear Regression Analyses indicates a strong, positive relationship between DIAPH1 area and Lipidtox Area in the human brain for ND samples (purple circles; R2 =0.917, p < 0.001) and no correlation between DIAPH1 area and Neutral Lipid Area for AD samples (green triangles; R2 < .001, p = 0.956). In addition, AD cases have significantly higher Neutral Lipid and DIAPH1 content. Data represented by mean +/− SD of n=10 cases per group (4–8 images analyzed per case) for histograms. Mann-Whitney-Wilcoxon non-parametric tests with p values indicated. Scale bars = 20 μm for all representative images. Linear Regression analysis is displayed with one dot per case and a line of best fit.

