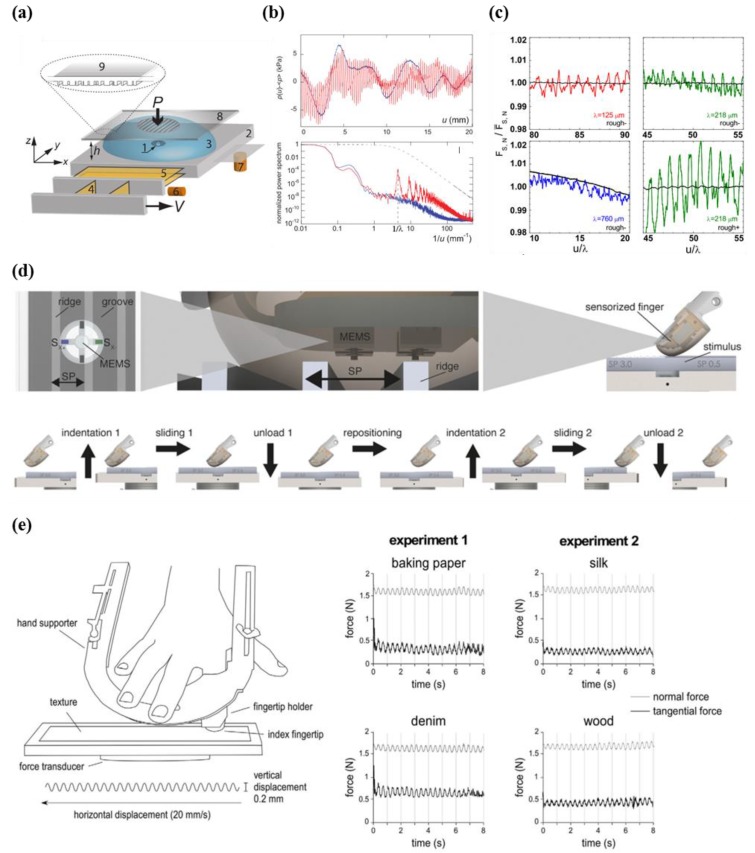
Figure 18.
(a) Schematic illustration of the measurement setup (left); (b) plot of pressure variation according to the displacement (smooth and fingerprinted fingers) (top). Output data of power spectra of signals from Fourier transform (bottom) (reprinted with permission for Figure 18a,b from Ref. [156] Copyright 2009 The American Association for the Advancement of Science); (c) plot showing the fluctuations (tangential force) with respect to μ/λ (reprinted with permission for Figure 18c from Ref. [157] Copyright 2011 American Physical Society). (d) Schematic illustration showing experimental setup and flow by using sensorized finger (reprinted with permission for Figure 18d from Ref. [9] under CC-BY 4.0 license); (e) illustration of experimental setup and tools (left), measured force as a function of time at various texture (baking paper, silk, denim, and wood) (right) (reprinted with permission for Figure 18e from Ref. [160] under CC-BY 4.0 license).

