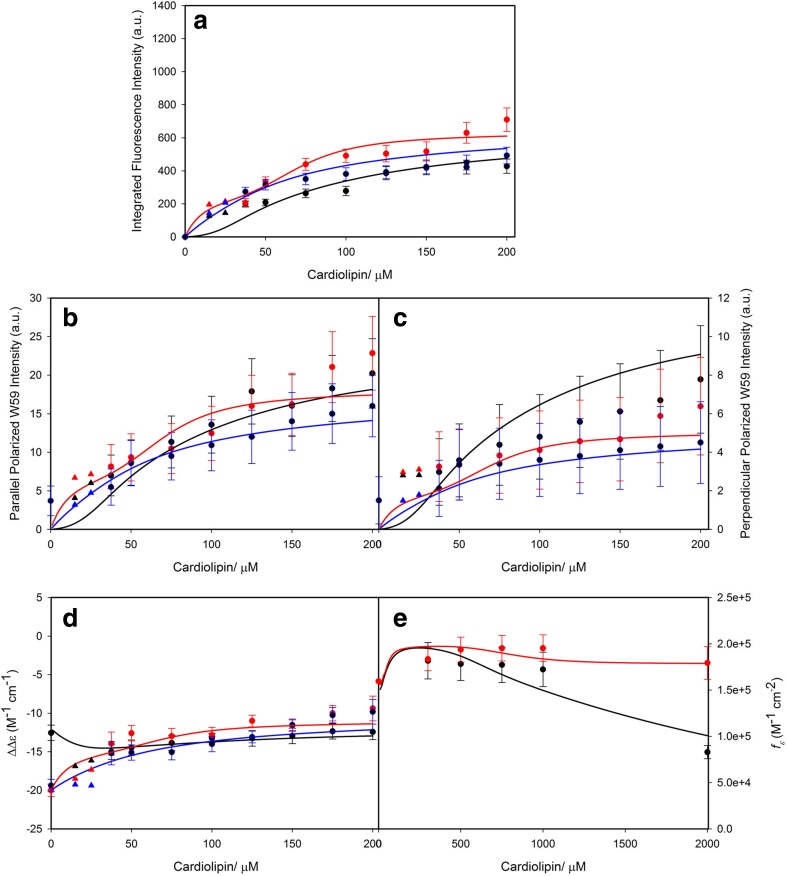
Fig. 16.
Dose response curves of the a integrated fluorescence intensity of sub-band F1, the b parallel and c perpendicular polarized fluorescence intensity at 340 nm, the d ΔΔε of the couplet peak of the Soret band CD spectra, and the e oscillator strength of the 695 nm absorption band of cyto to an increasing CL concentration for TOCL/DOPC liposomes with 20% (black), 50% (red), and 100% (blue) CL-content. These curves were obtained in the presence of 100 mM NaCl for 20% CL-content, 200 mM NaCl for 50% and 100% CL-content. The two cardiolipin concentrations omitted for the fitting procedure concentrations are symbolized by triangles. The solid lines result from a fitting procedure that is described in detail in the main manuscript. Captions and figure were taken from the Supporting Information of ref. (Pandiscia and Schweitzer-Stenner 2015b)

