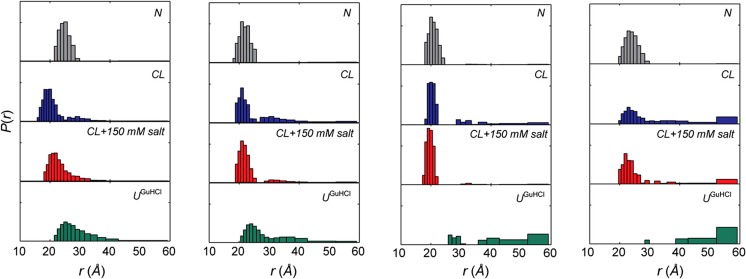
Fig. 28.
Distribution of donor-acceptor distance P(r) obtained from FRET experiments four DNS-labeled variants of cyto c at pH 7.4 [native (N), gray]; with TOCL/DOPC liposomes at 660 μM total lipid [CL-bound (CL), blue]; with TOCL/DOPC liposomes at 660 μM total lipid and 150 mM NaCl (CL. salt, red); and in 5.8 0.2 M GuHCl solution at pH 7.4 [GuHCl-unfolded (UGuHCl), green]. The figure was taken from ref. (Hanske et al. 2012) and modified.

