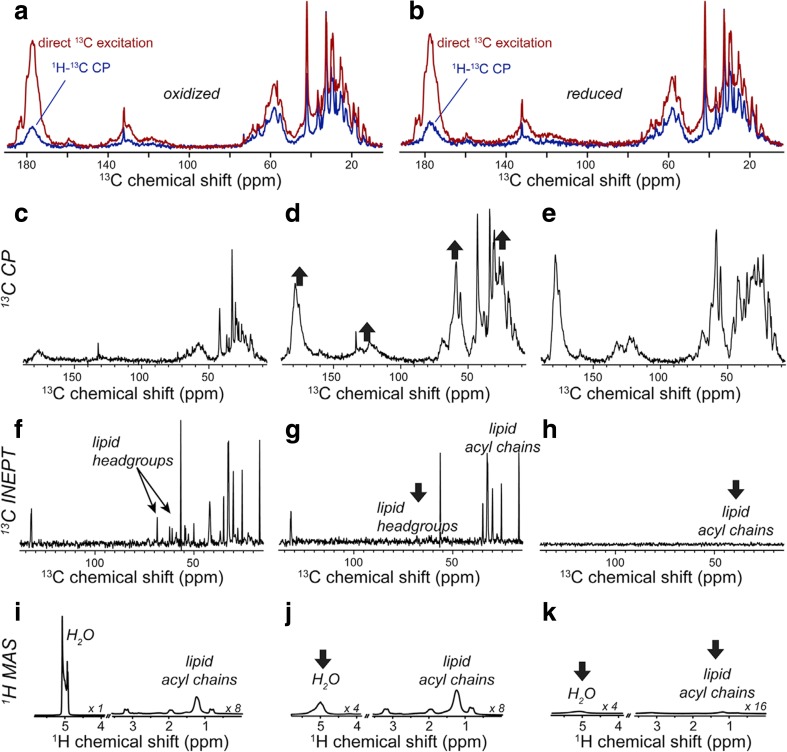
Fig. 30.
1D MAS NMR spectra of oxidized and reduced U-13C,15N cytochrome c bound to TOCL/DOPC LUVs. a, b 1H-13C CP and direct excitation 13C spectra of oxidized and reduced membrane-bound cytochrome c measured at 271 K. The spectra in each panel are plotted with absolute intensities, and were processed with 25 Hz exponential line broadening and fourfold zero-filling. c 1H-13C CP spectrum measured at 257 K, showing mostly lipid signals. d CP spectrum at 250 K, and e 236 K, with much increased protein signals (up arrows). f 1D 1H-13C refocused INEPT spectrum at 257 K, with mostly lipid peaks (headgroups marked). g, h INEPT data at 250 and 236 K, showing loss of lipid headgroup and acyl chain signals, respectively (down arrows). i 1D 1H spectrum at 257 K, with intense liquid water peak. j 1D 1H spectrum at 250 K, after freezing of solvent (down arrow). k 1H 1D at 236 K, showing a loss of acyl chain signals (down arrow). Data obtained at 600 MHz (1H) and 8.33 kHz MAS, and processed with a cosine-bell apodization function and zero-filling to twice the original size. Selected spectra are scaled as indicated. The figure and most of the caption was taken from ref. (Mandal et al. 2015) with permission

