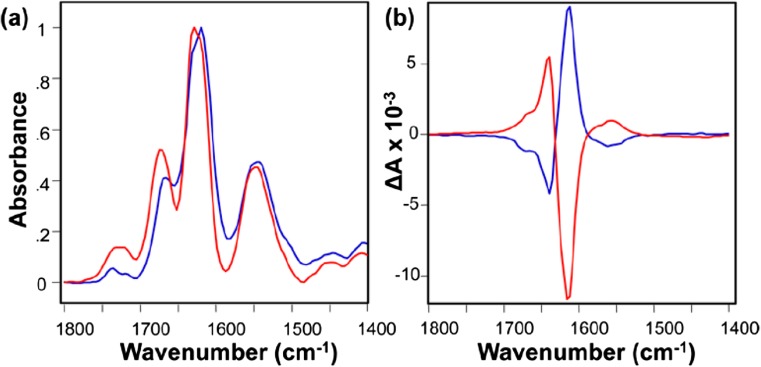
Fig. 3.
IR amide I bands (a) and corresponding VCD spectra (b) of HET-s218–289 amyloid fibrils at pH 2.0 (red) and pH 6.0 (blue). Fibrils initially formed at pH 2.0 exhibited a left-handed twist, and when the pH was increased to 6.0, the chirality of the fibrils reversed, as proved by the inversion of the VCD signal. This example highlights the complementarity of VCD to IR, where spectra at both pHs look very alike. Reprinted with permission from Shanmugasundaram et al. 2015. Copyright © 2015 American Chemical Society

