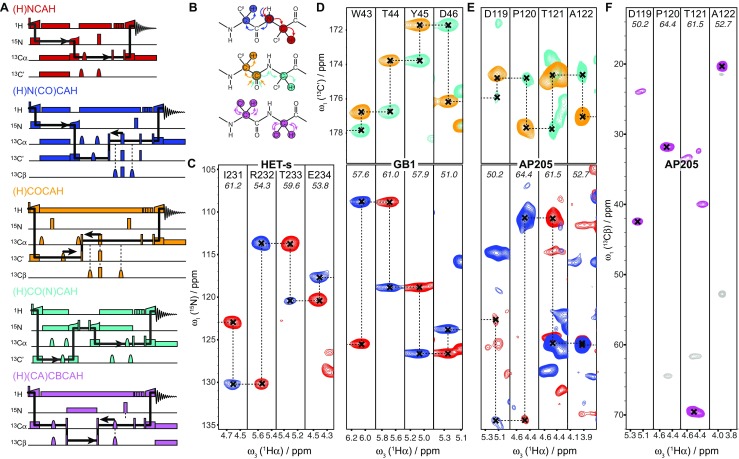
Fig. 4.

a Simplified correlation pulse sequence schemes, with indirect chemical shift evolution periods indicated by black arrows. b Intramolecular magnetization flows corresponding to the color-matching correlation pulse sequences presented in (a). 2D cross-sections of 15N- (blue and red) and 13C′-linked (orange and cyan) Hα-detected spectra of c HET-s218–289, d GB1, e AP205CP and the respective intra-residue Cβ-Cα-Hα correlations for AP205 (f). Reprinted with permission from Stanek et al. 2016. Copyright © 2016 by John Wiley & Sons, Inc.
