Fig. 3.

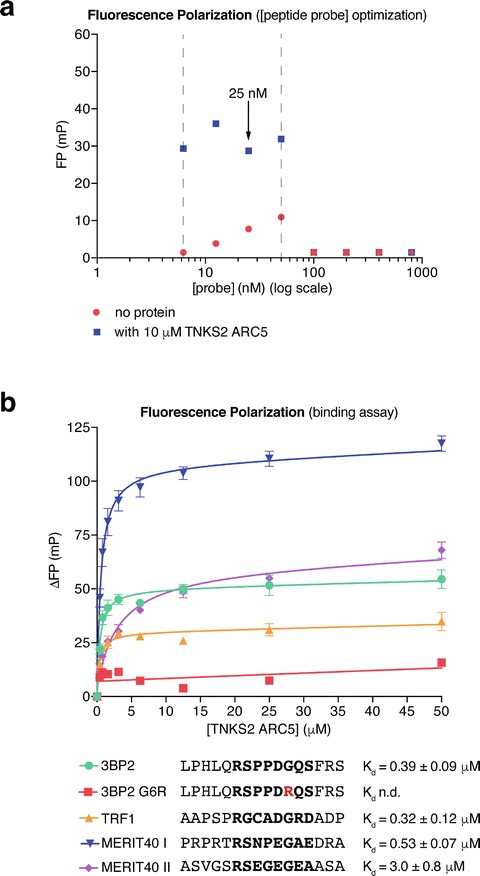
Assessing ARC–TBM peptide interactionsARC-peptide interactions by fluorescence polarizationFluorescence. (a) Optimization of the peptide probe (3BP2) concentration for the FP binding assay. Data are from one experiment performed in technical duplicate with mean FP values plotted. The dashed vertical lines indicate the suitable peptide probe concentration range. 25 nM was chosen for the subsequent assays. (b) FP binding assays for the TBM peptides from TRF1, MERIT40, and 3BP2 (WT positive control and G6R negative control). Peptide sequences (octapeptide in bold) and affinities for TNKS2 ARC5 are indicated. n = 3 separate experiments; error bars, SEM. The error values for the dissociation constants correspond to the standard error of the fit in nonlinear regression. n.d., not determined (no binding curve)
